Reports
During the use of the Action Audit module, users in various auditing roles input a large amount of data into the system, which can then be used not only for ongoing operational activities but also as a source of data for reports.
Reports can be found in two locations:
- In the report center
- In the completed audit view
Report center
The screen providing access to all reports is available in the left menu bar, under the Audits tab, in the Reports section.
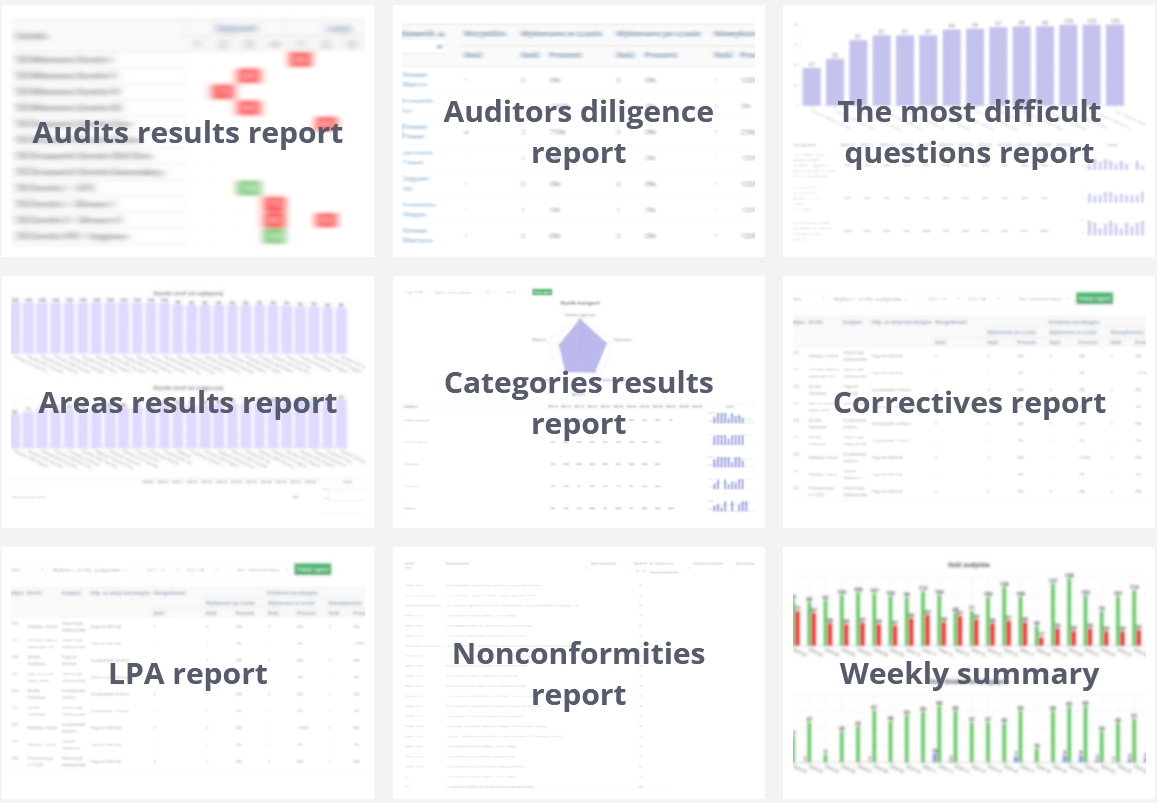
The following types of reports are available in the audit module:
- Audits results report
- Auditor diligence report
- The most difficult questions report
- Areas results report
- Category results report
- Correctives report
- LPA report
- Nonconformities report
- Measurements report
- Weekly summary
Audits results report
This report allows users to view the percentage results of audits in different areas. By presenting results in a schedule format, users can conveniently see the outcomes achieved in each week of a given month. The colored blocks in the schedule have the following meanings related to the score threshold set for a given area:
- Color green indicates Audit OK
- Color red indicates Audit NOK
- Color gray indicates status In progress
- Color dark gray indicates status Unexecuted
- Color blue indicates status Scheduled
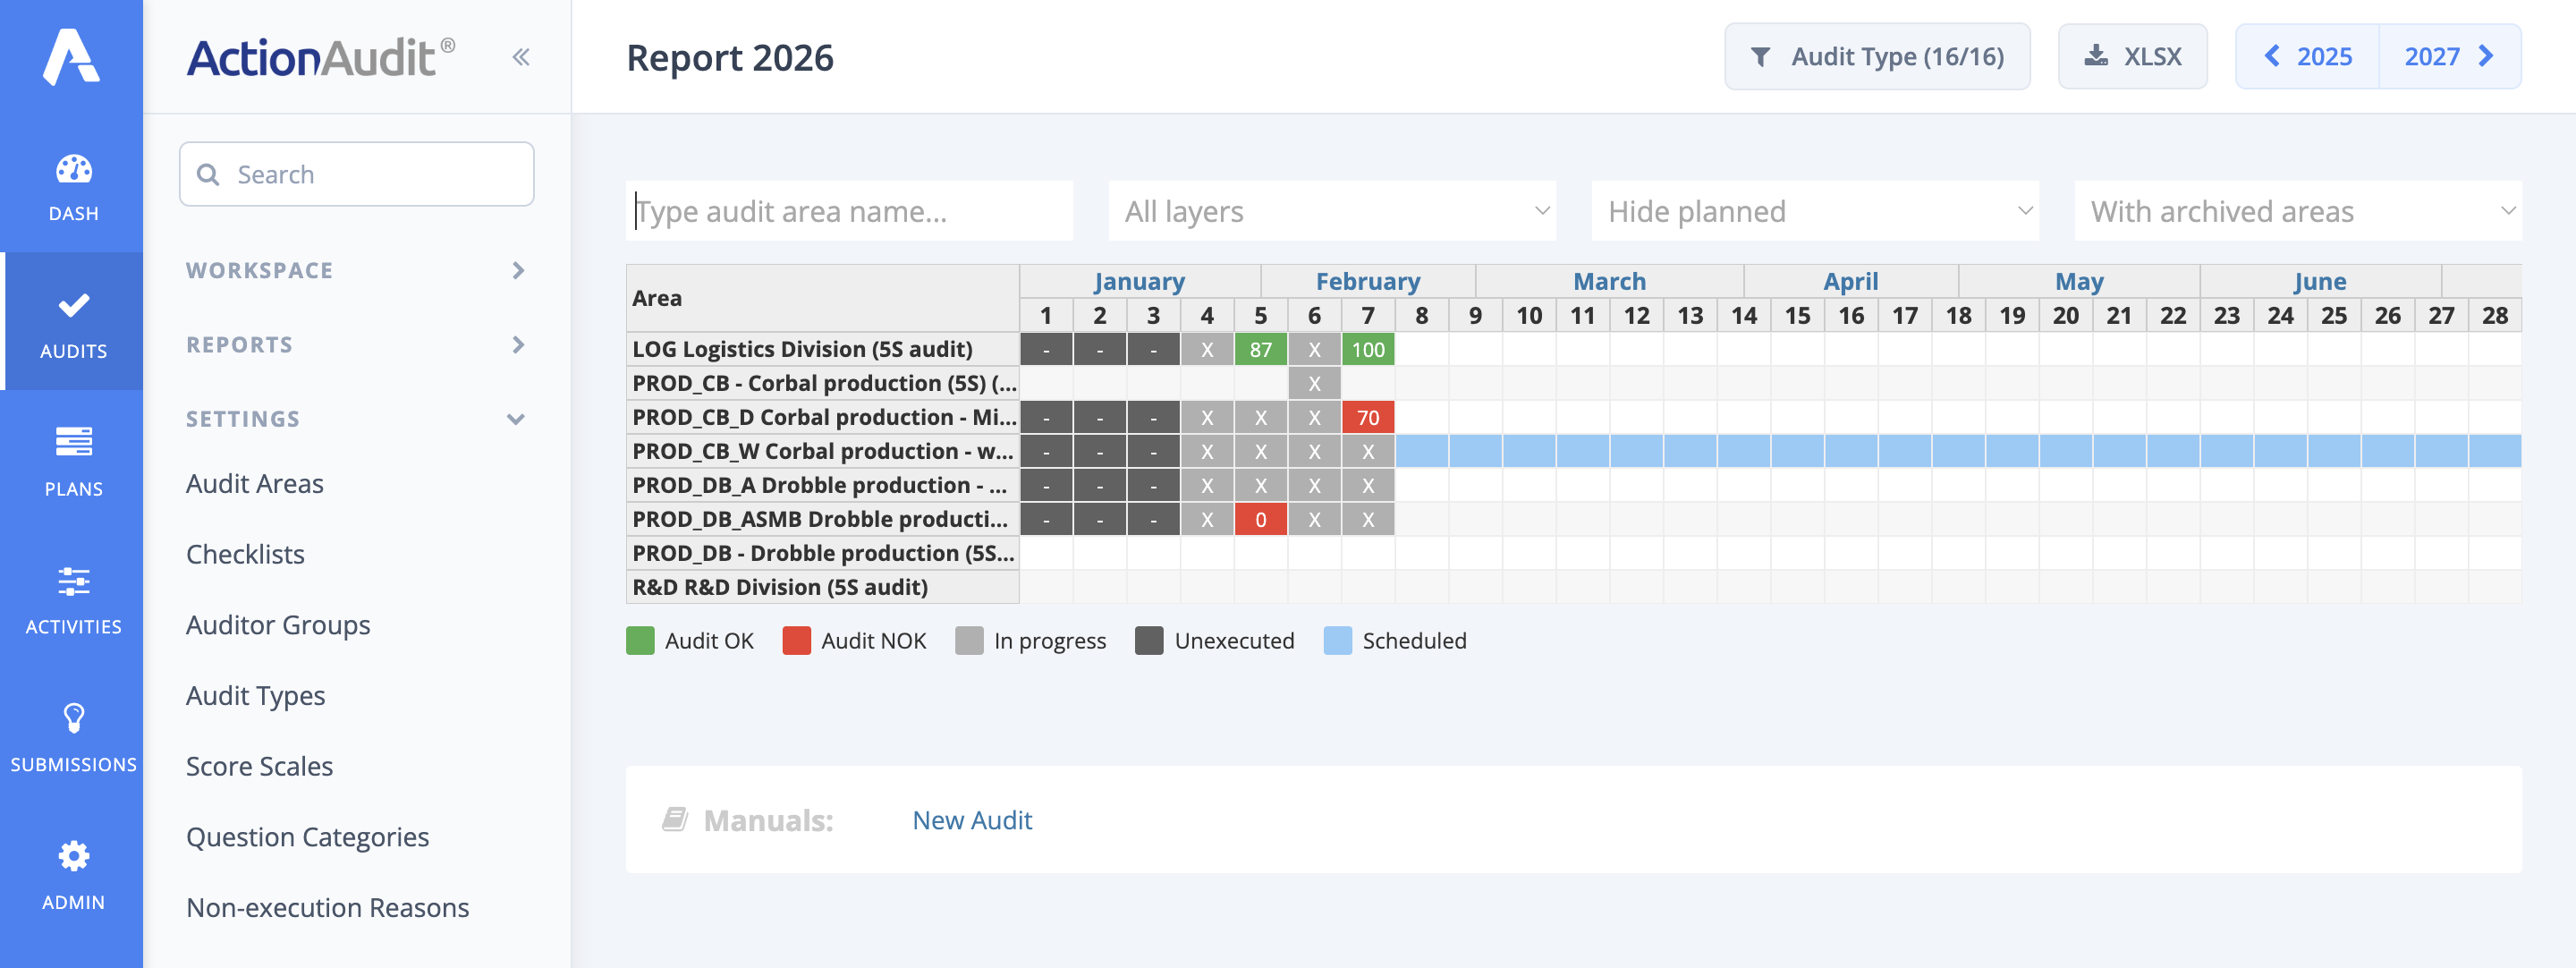
By default, the screen opens to an annual view divided into months and weeks. More details can be found in the monthly view by clicking on the name of the selected month in the report table header.
If more than one audit was conducted in a given week in an area, the audit result is the arithmetic average of all audit scores. These will be displayed by clicking on the block in the schedule.
The following options are available on the top bar of the report view:
- Type - audit type filter
- XLS - option to export the report to an Excel file
- previous year / next year - scroll through the report view
Auditor diligence report
The Auditor Diligence Report is presented in a table with rows. Each row corresponds to individuals conducting audits over a selected period.
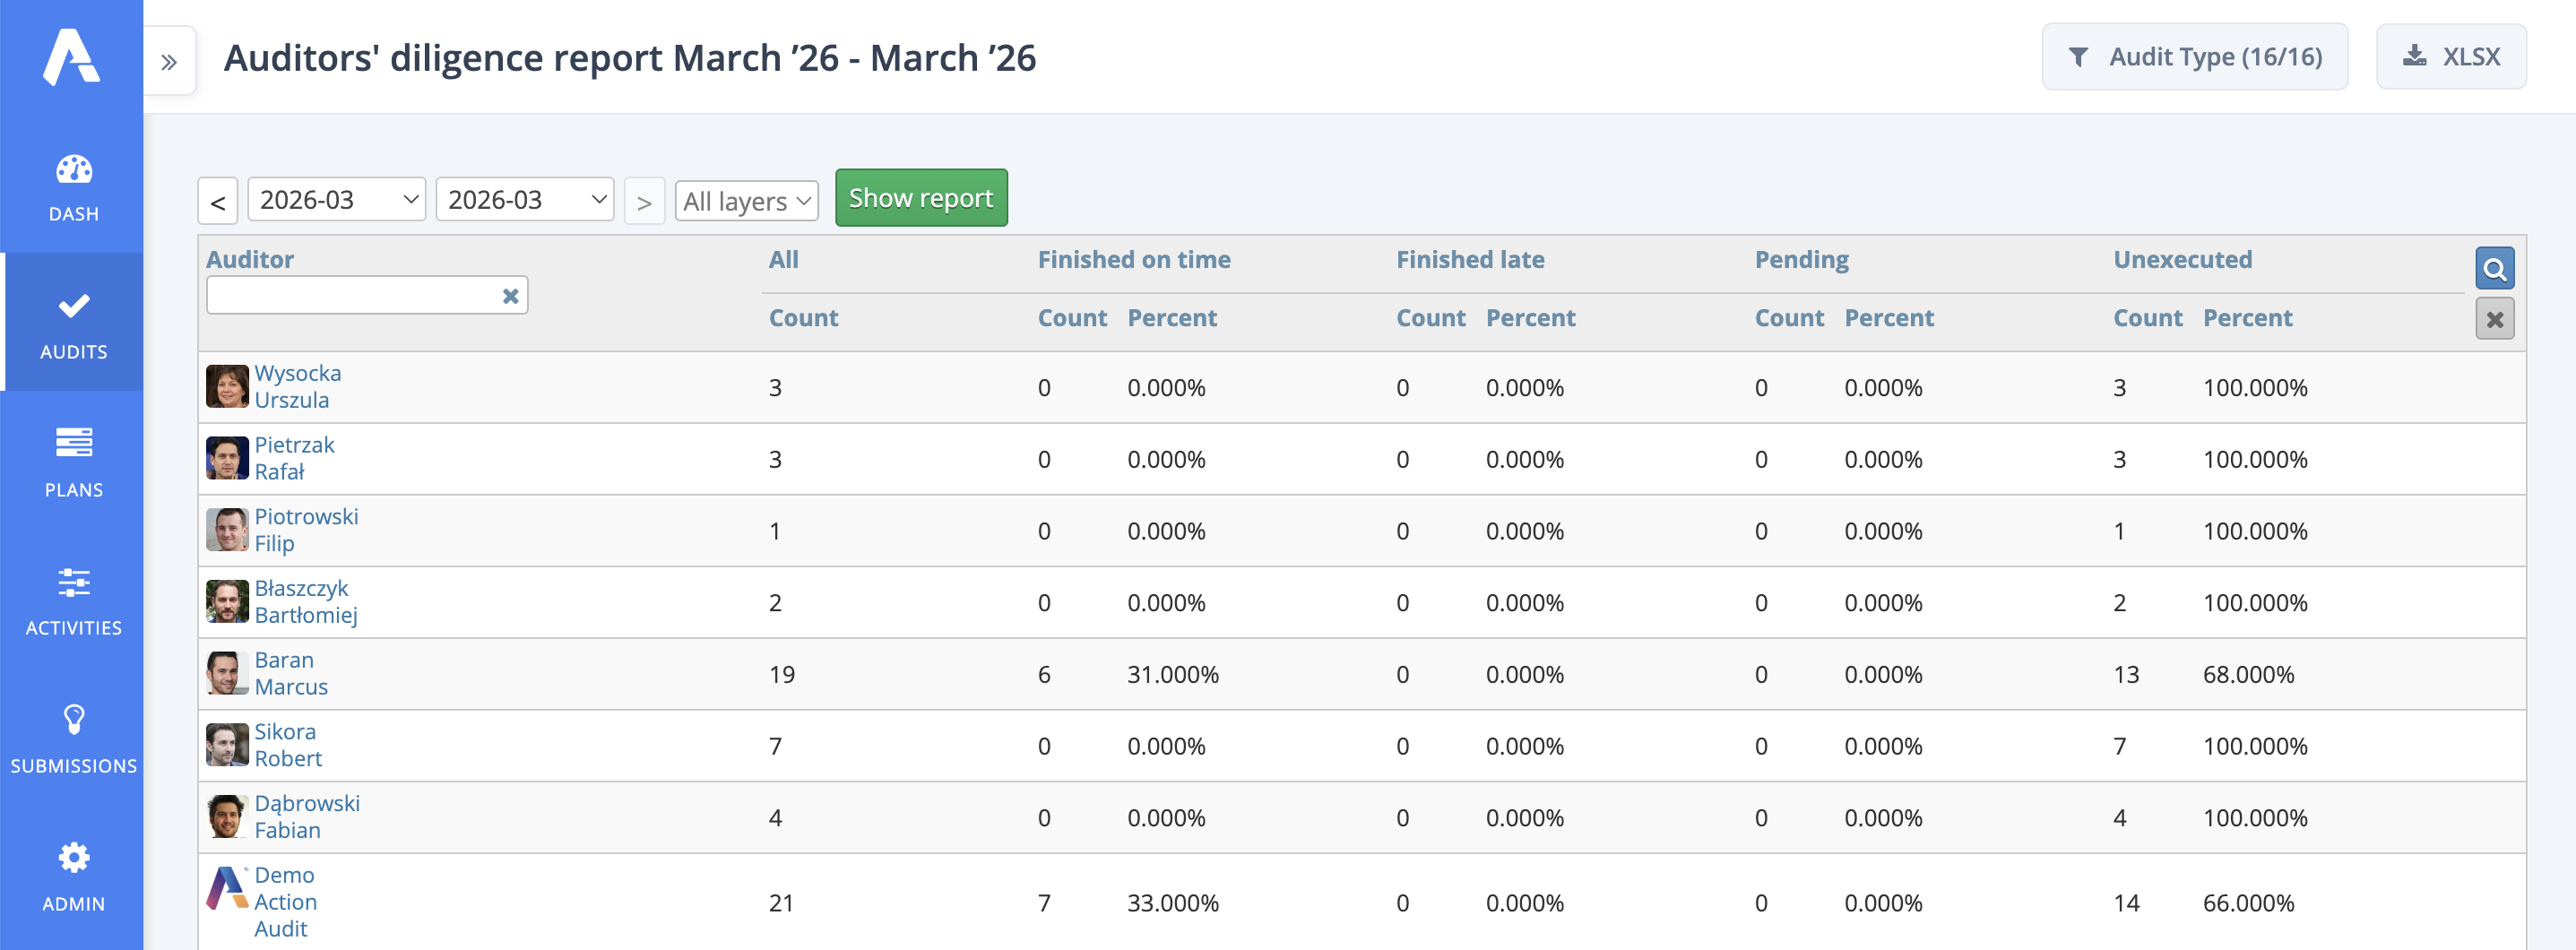
At the top of the panel, it is possible to change the following parameters:
- date range - the time period for which we want to obtain information on auditor diligence
- layer selection - the audit layer for which we want to obtain information
- Show Report - a green button that allows generating the report based on the selected parameters
The following columns provide relevant statistics:
- Auditor - the name of the auditor the row refers to
- All - the number of audits assigned to the person in the selected time period
- Finished on time - the number of audits conducted before the deadline specified in the audit “ends on” date and the corresponding percentage value
- Finished late - the number of audits conducted after the deadline and the corresponding percentage value
- Pending - the number of audits remaining to be completed and the corresponding percentage value
- Unexecuted - the number of audits marked as Unexecuted
The most difficult questions report
The purpose of the Most Difficult Questions Report is to identify the most problematic questions from the perspective of the audited person. The report focuses on presenting the percentage share of correct answers out of all provided answers.
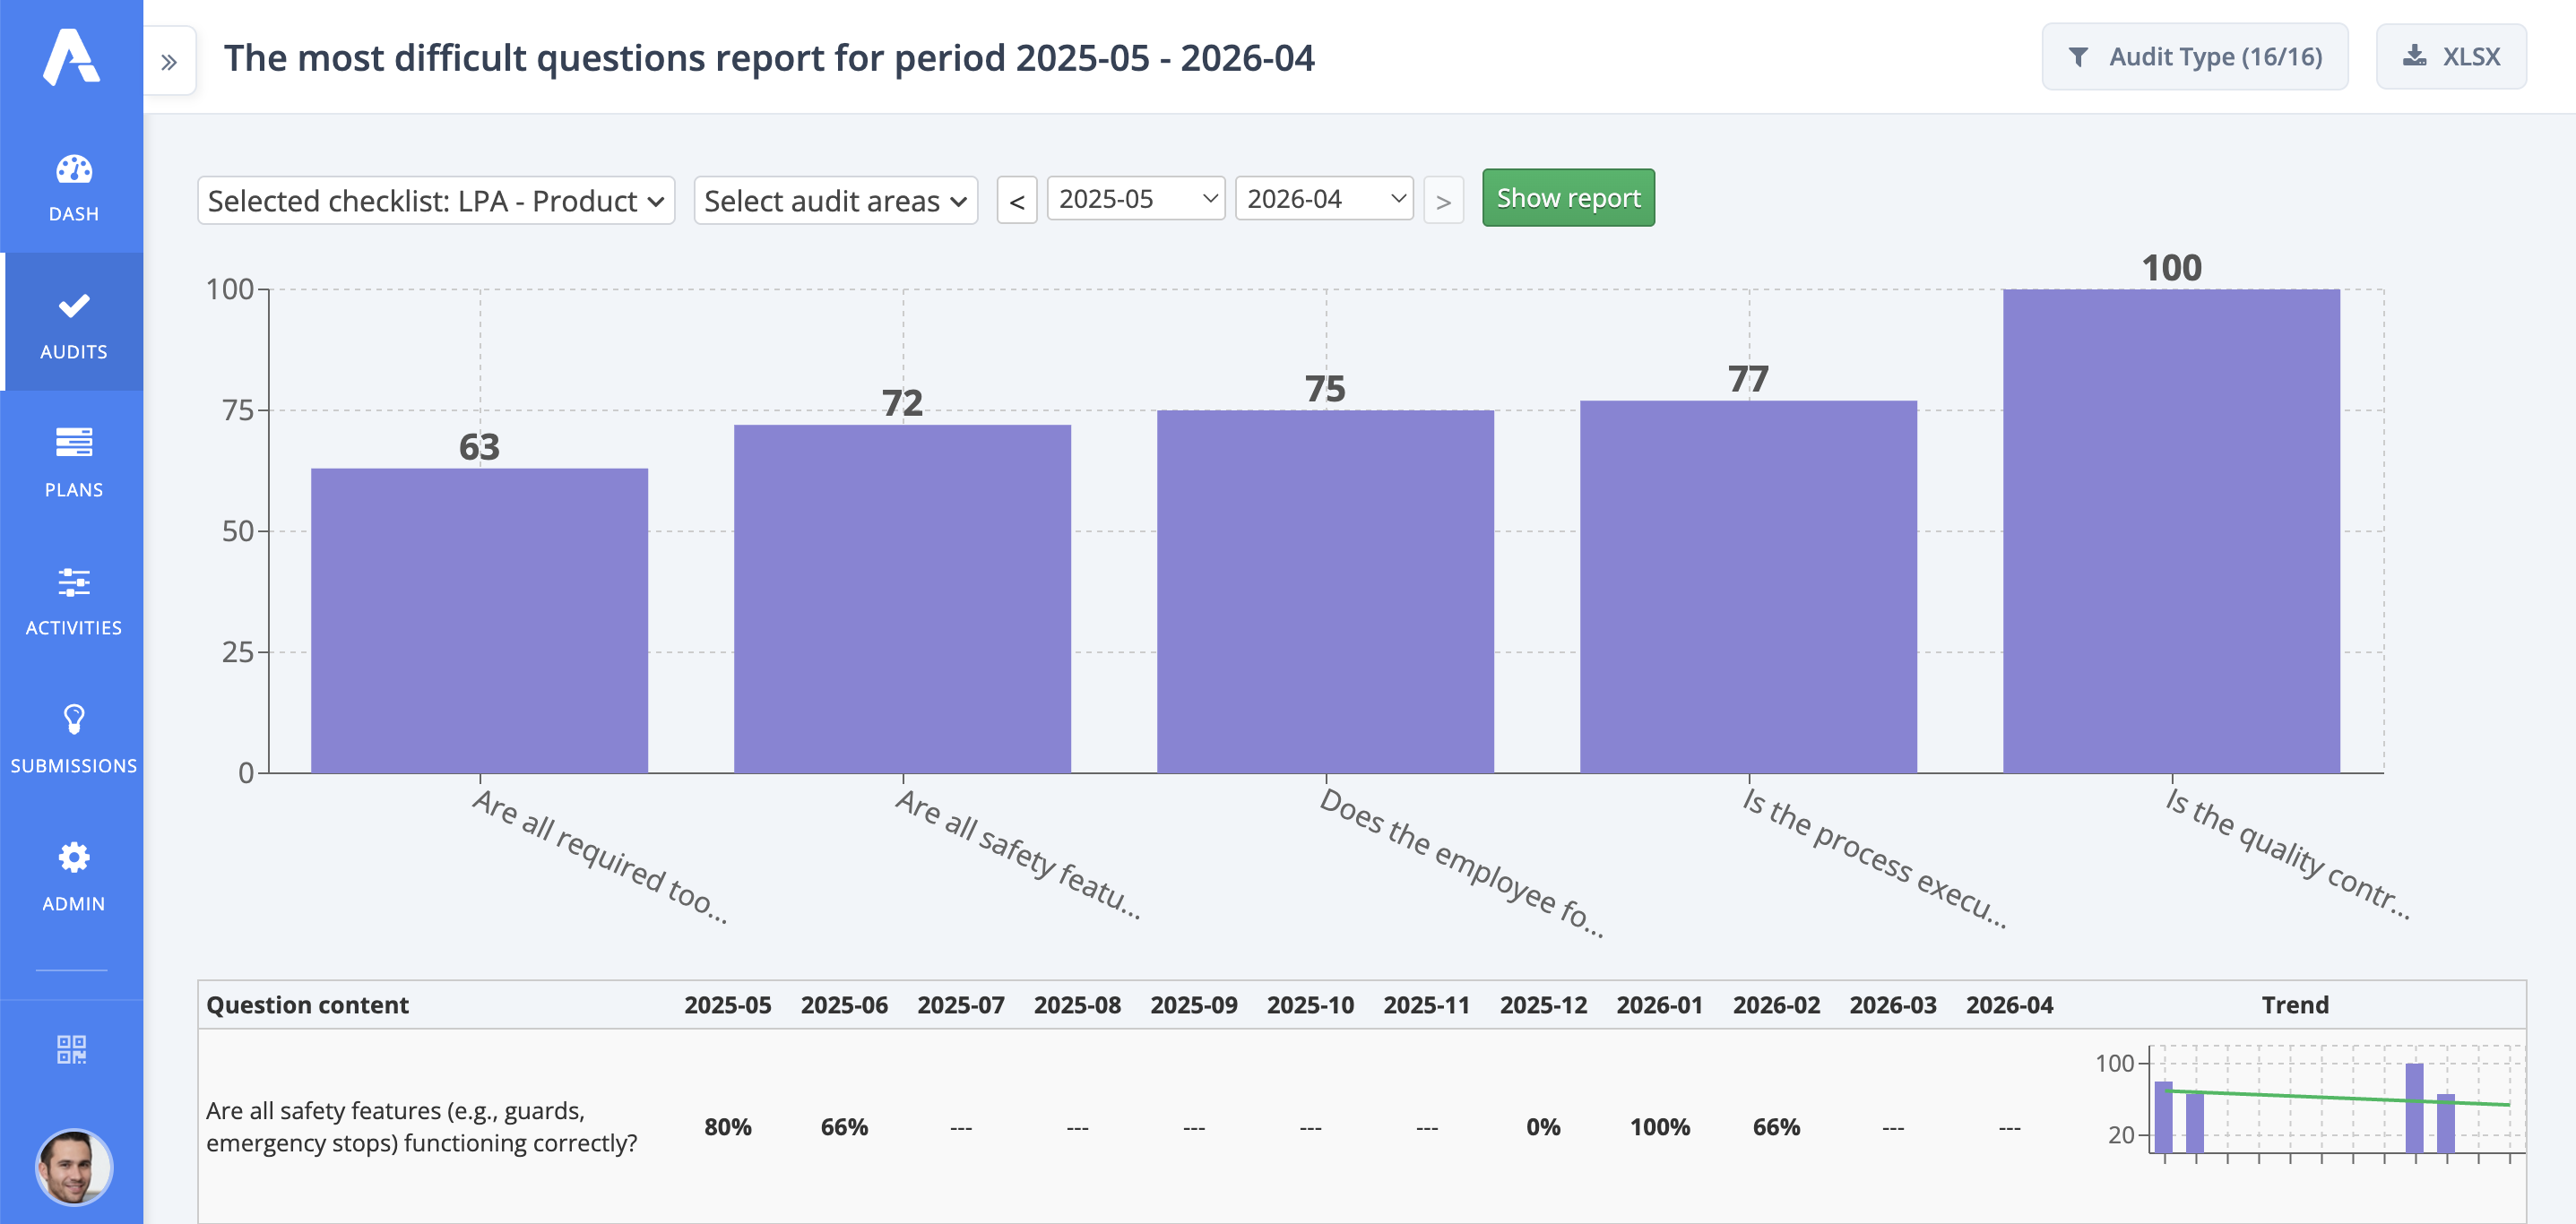
The report consists of four main elements:
- data range filter at the top of the screen, along with additional options:
- checklist selection
- multi-filter for selecting audit areas
- filter for selecting the month range from to
- TOP questions bar chart from the selected checklist
- trend table of correct answers to questions over the specified period
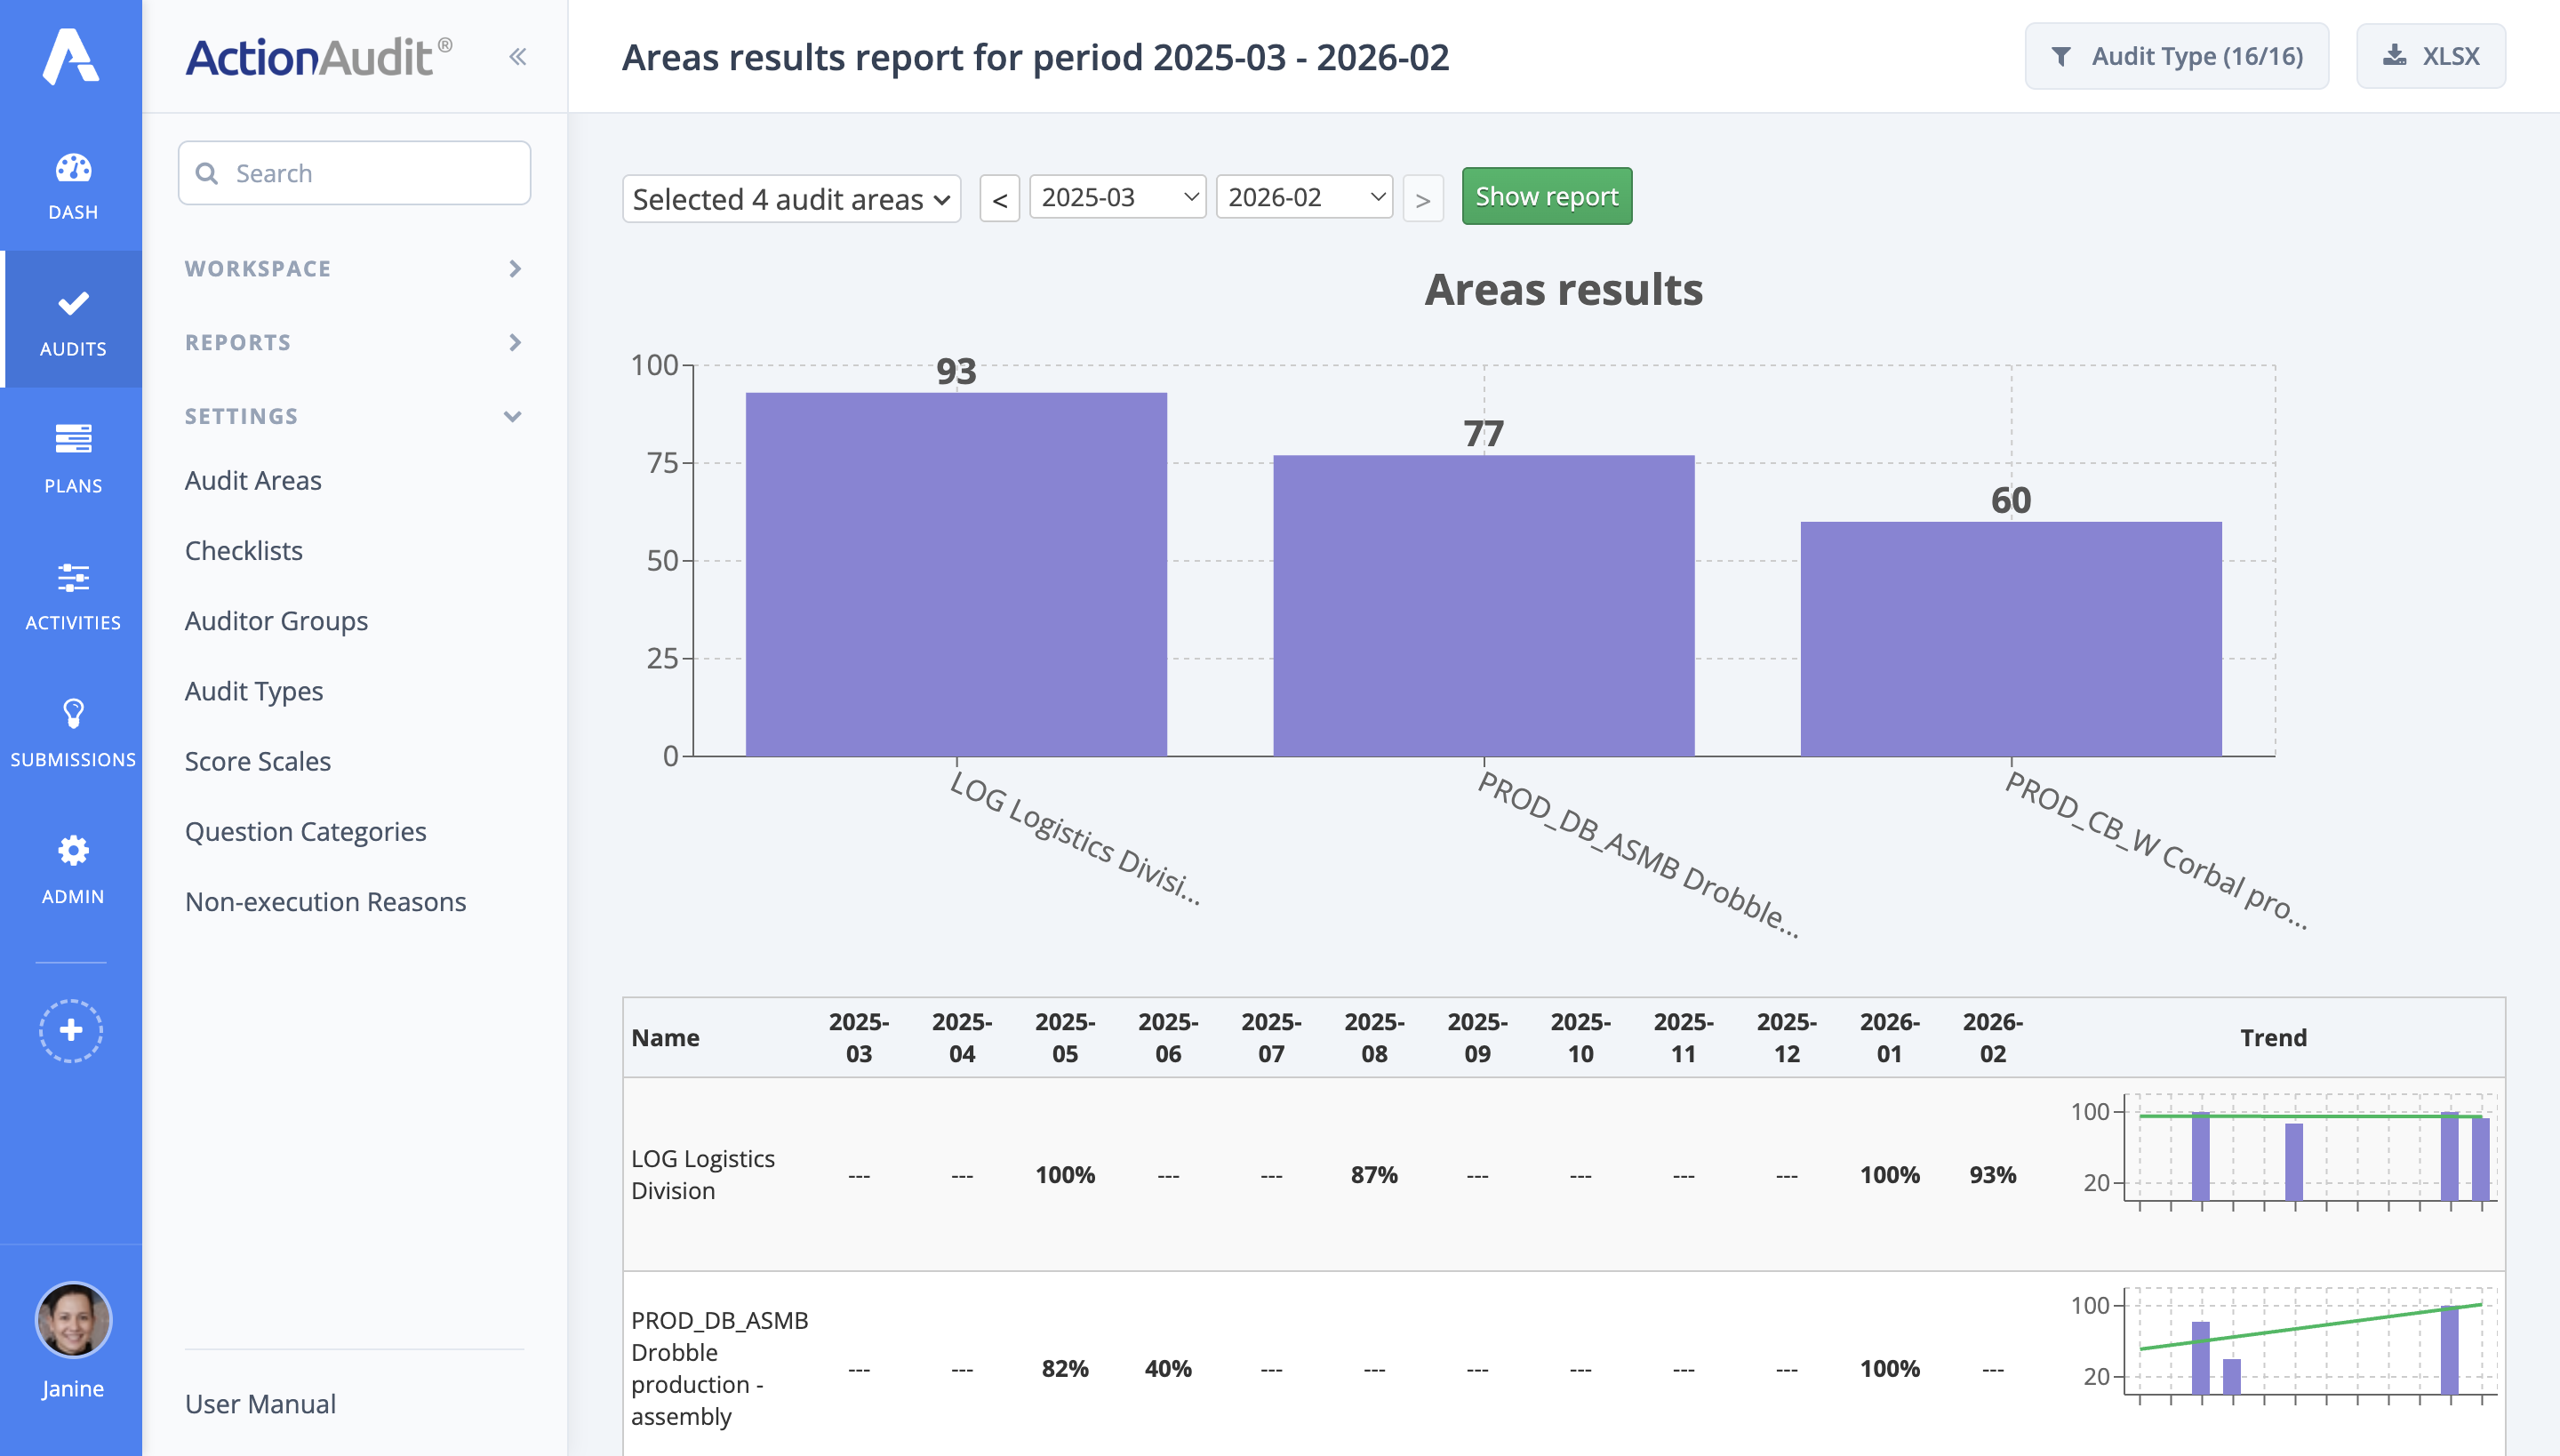
Areas results report
The goal of the Areas results report is to identify audit areas with the best and worst results over a given period. The report, depending on the number of selected areas, consists of three or four main elements:
- data range filter at the top of the screen, along with additional options:
- checklist selection
- filter for selecting the month range from to
- bar chart of area results showing up to 25 areas ranked from best to worst
- trend table of results achieved in specific areas over the specified period
A fragment of the Area results report_ is shown in the image below.
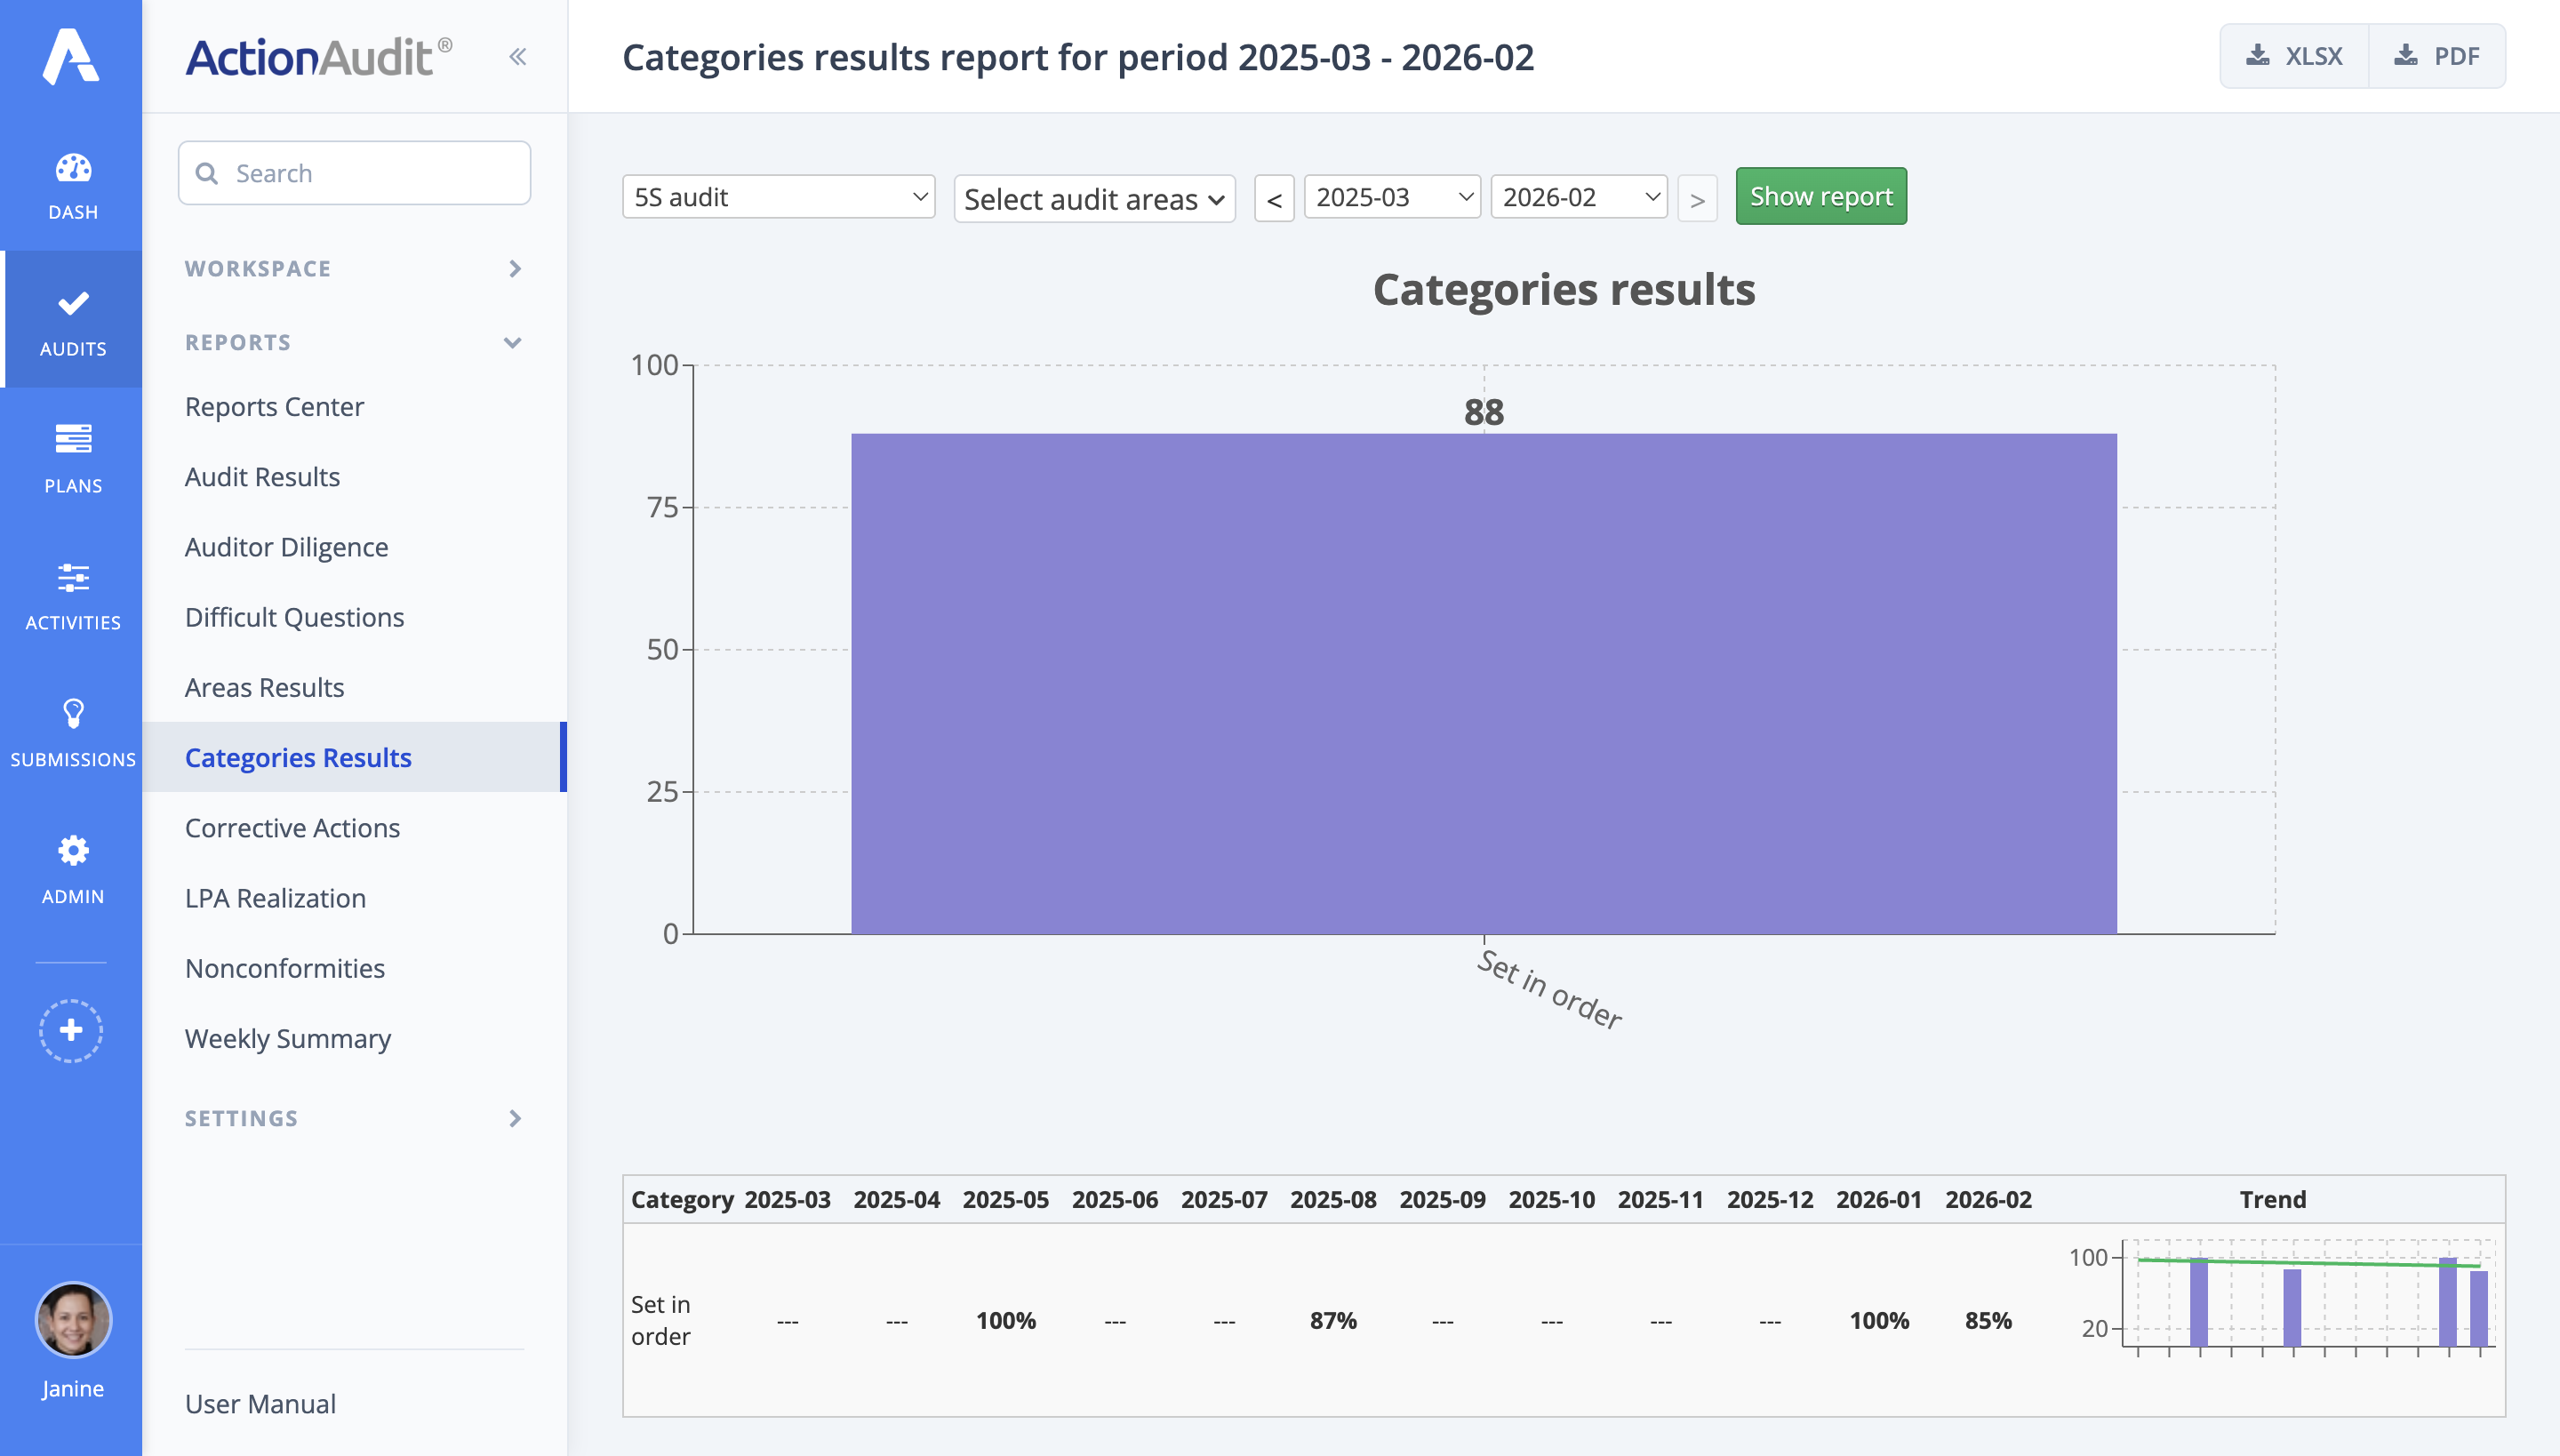
Categories results report
The goal of the Categories results report is to present the results achieved in different categories of questions over a given period on a spider chart. Using this report is therefore relevant only for audit types with multiple defined categories, such as 5S/6S: Sort, Set in order, Shine, Standardize, Self-discipline, Safety.
The report consists of three main elements:
- data range filter at the top of the screen, along with additional options:
- audit type filter
- multi-filter for selecting audit areas
- month range filter from to
- radar chart of question categories
- trend table of results achieved in different categories over the specified period
A fragment of the Categories results report is shown in the image below.
Correctives report
This report is in the form of a table and provides information on the number and percentage share of corrective actions grouped into four categories:
- Audit type
- Area
- Auditor
- Corrective plan assignee
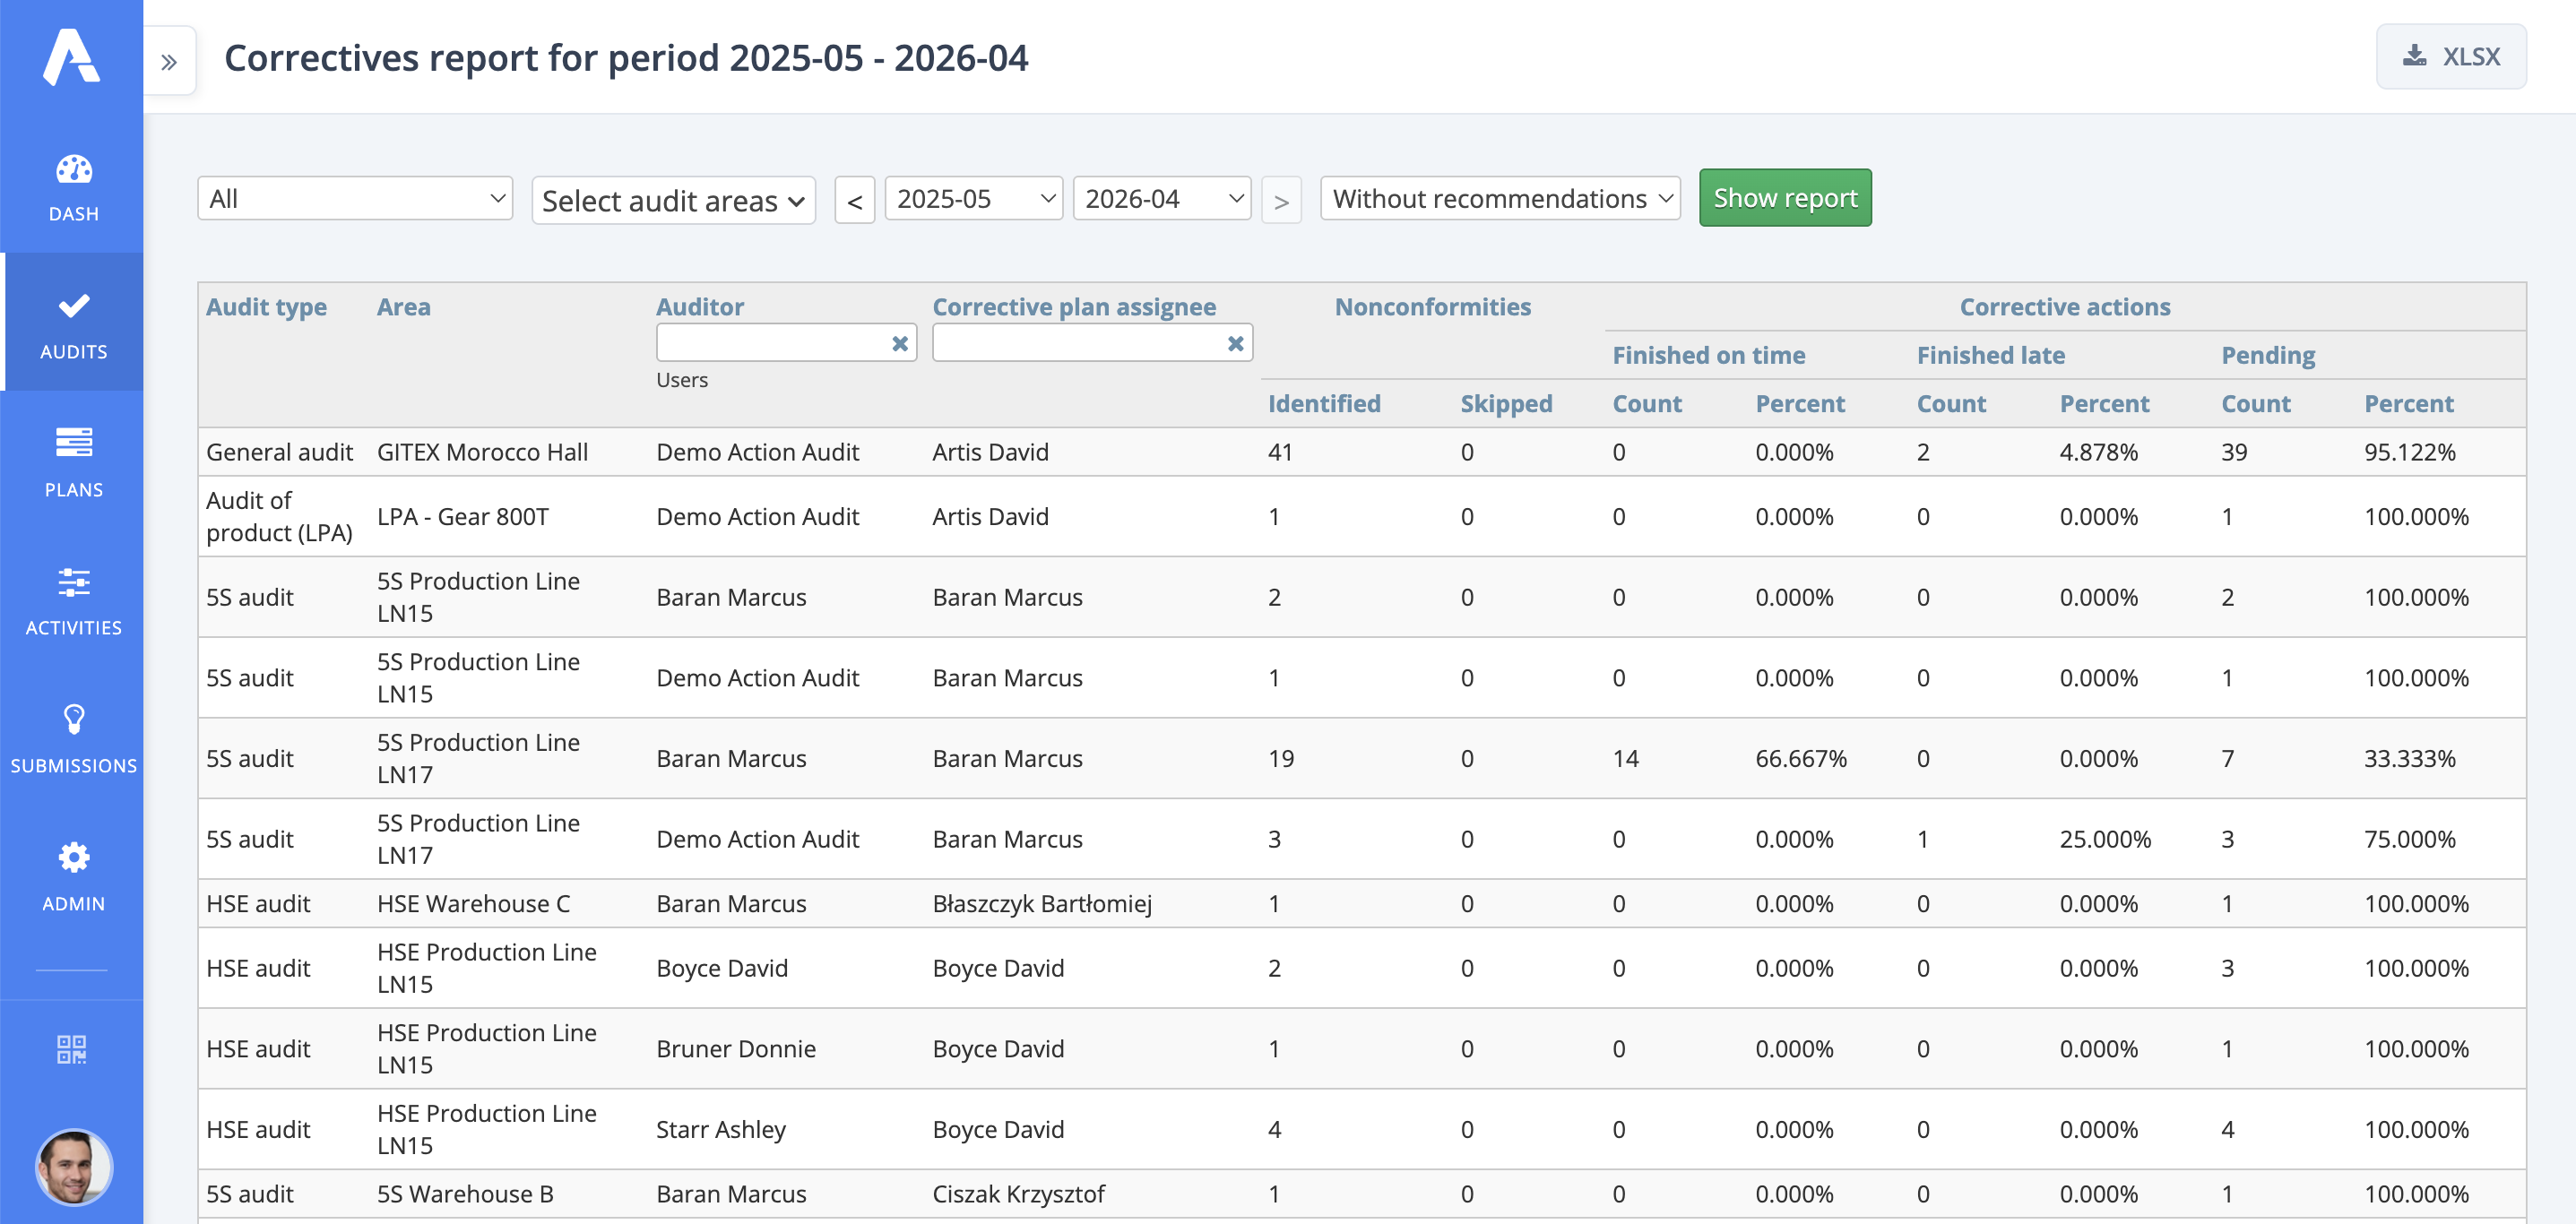
The report consists of two main elements:
- Data range filter at the top of the screen, along with additional options:
- Audit type filter
- Multi-filter for selecting audit areas
- Month range filter from to
- Filter for choosing the option without recommendations or with recommendations
- Results table containing the following columns:
- Audit type
- Audit area
- Auditor
- Person responsible for corrective actions
- Number of reported non-conformities
- Number of corrective actions completed on time (as a number and as a percentage)
- Number of corrective actions completed late (as a number and as a percentage)
- Number of corrective actions remaining to be done (as a number and as a percentage)
LPA report
The LPA Report provides information about LPA report results.
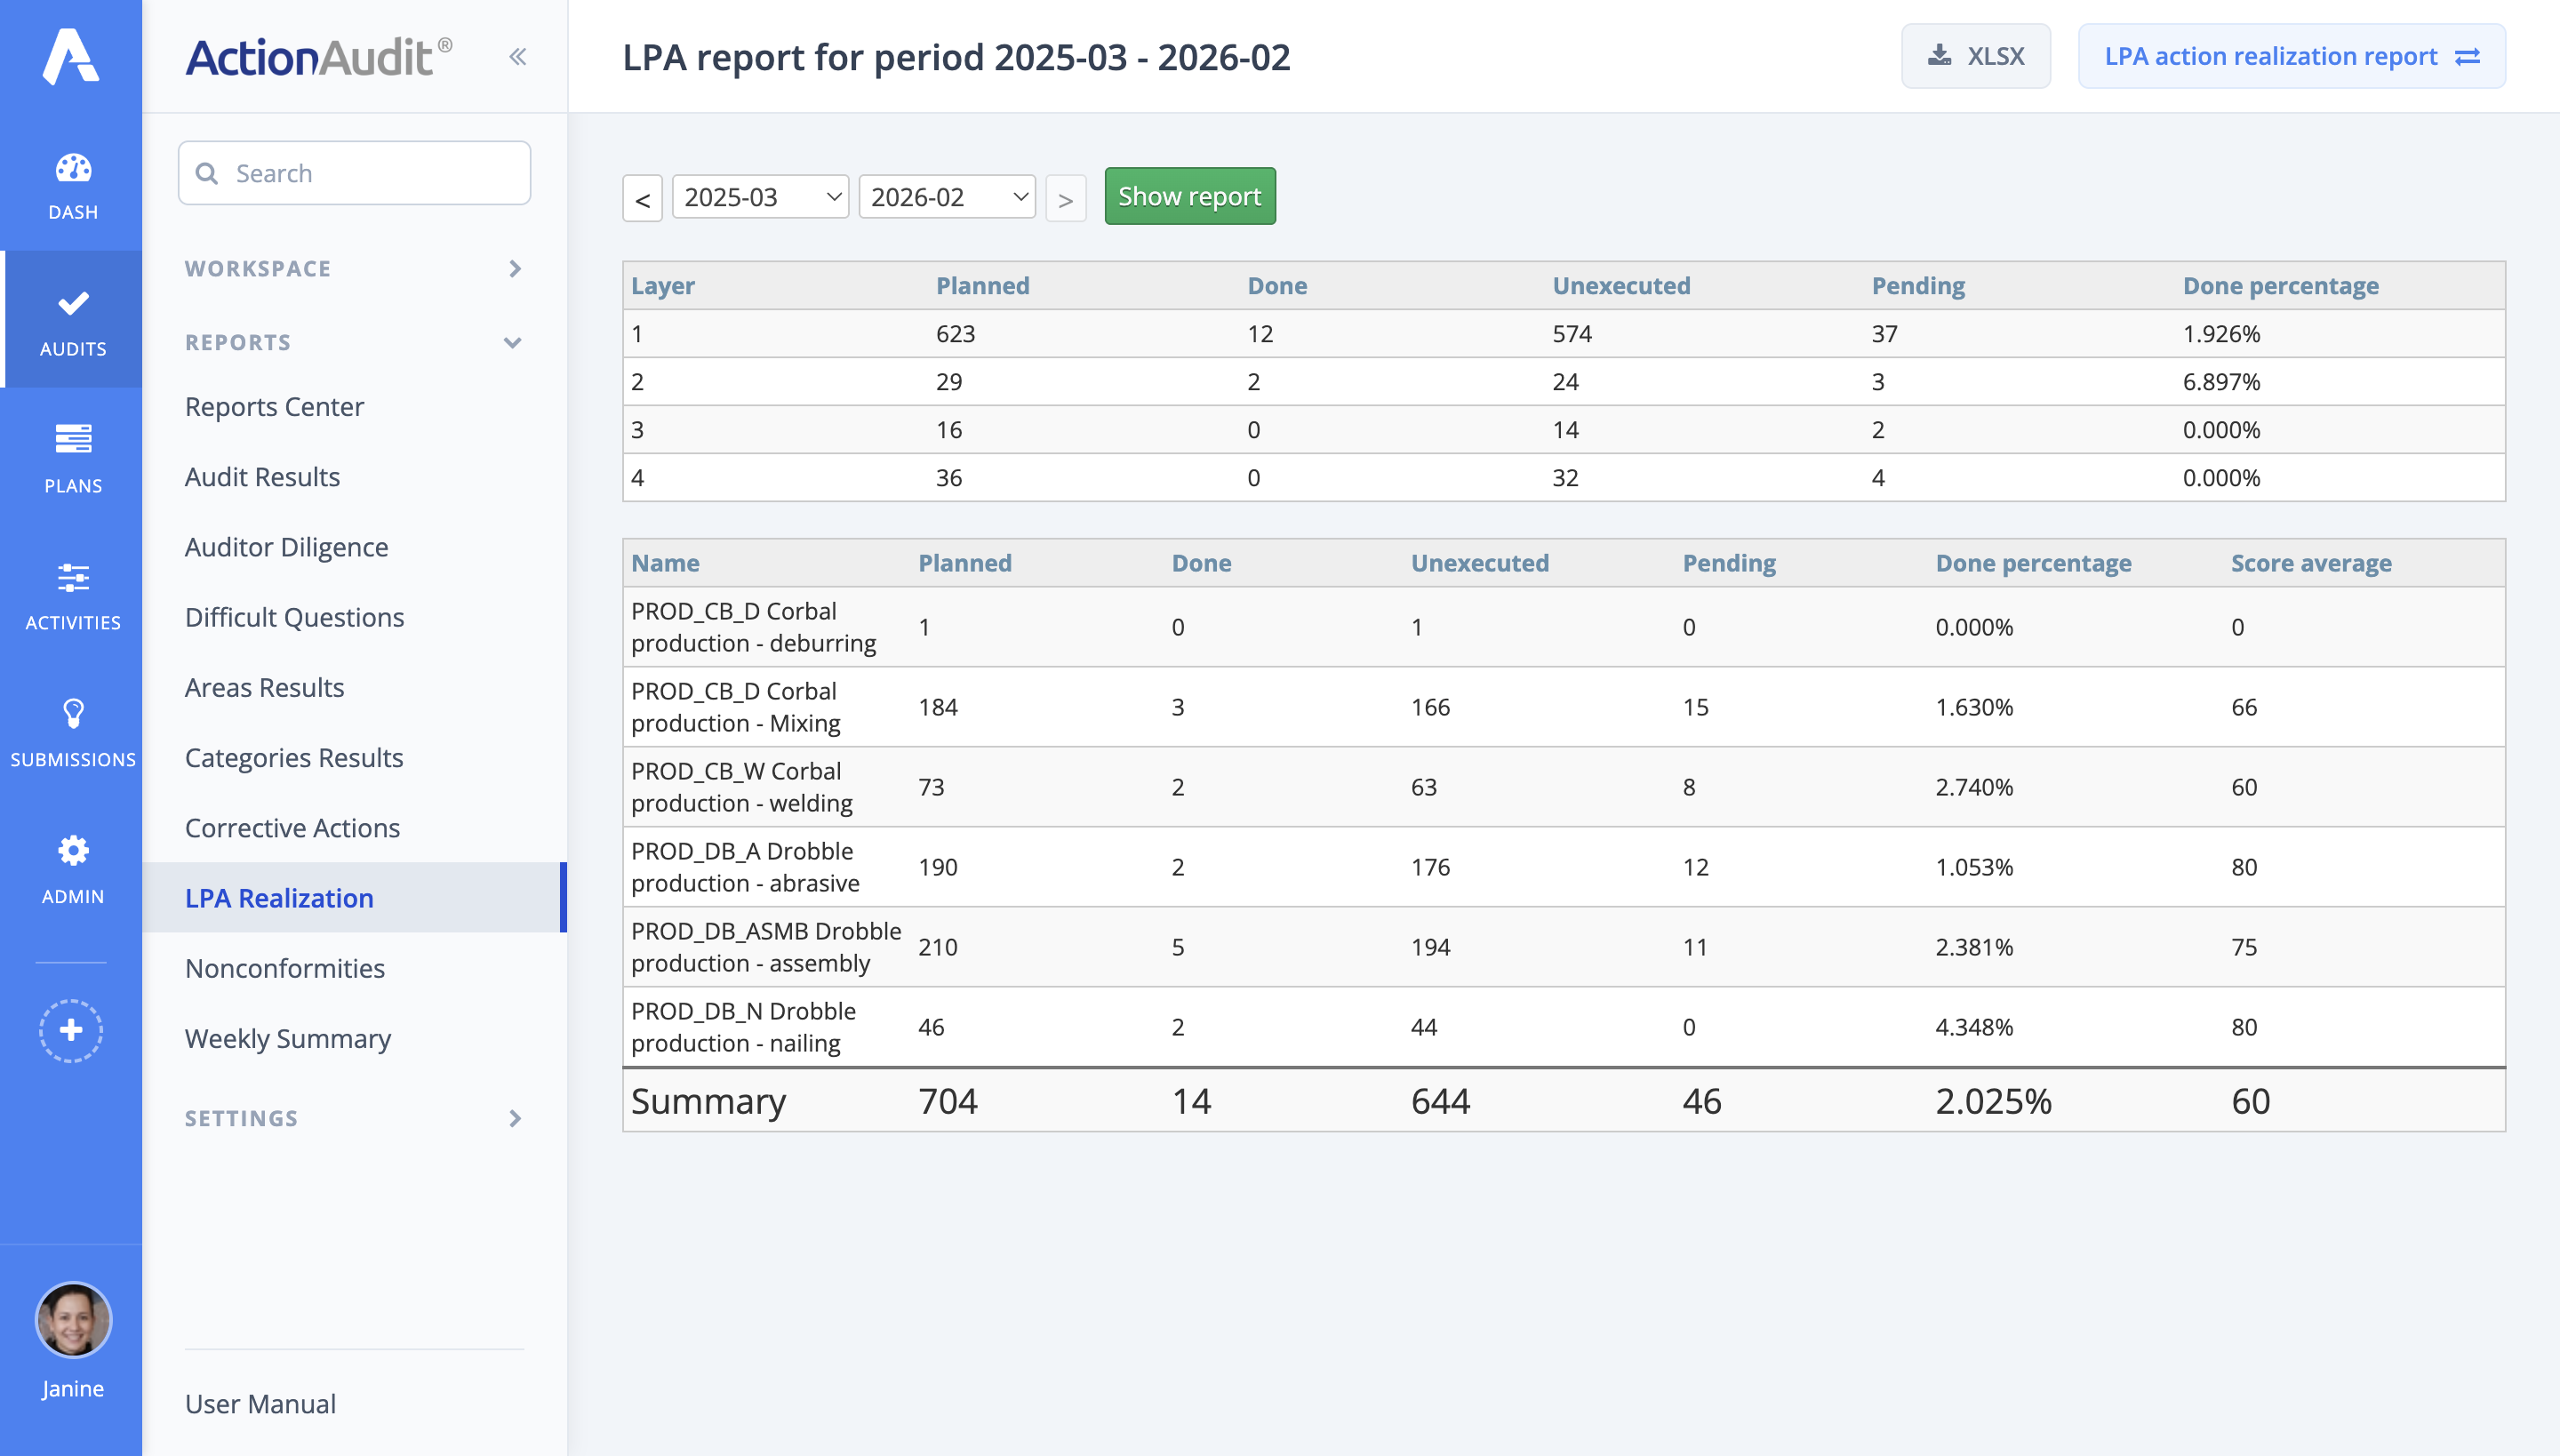
In the LPA report view, the report consists of:
- date range filter
- filter bar with options to select the auditor and the person responsible for corrective actions
- a table with quantitative and percentage results for the following categories:
- Detected nonconformities - the number of identified nonconformities in a given area
- Finished on time - the number of audits completed before the planned completion date
- Finished late - the number of audits completed after the planned completion date
- Pending - the number of audits remaining to be done
There is also the option to switch the report view to the LPA action implementation report by pressing the green button in the upper right corner of the screen.
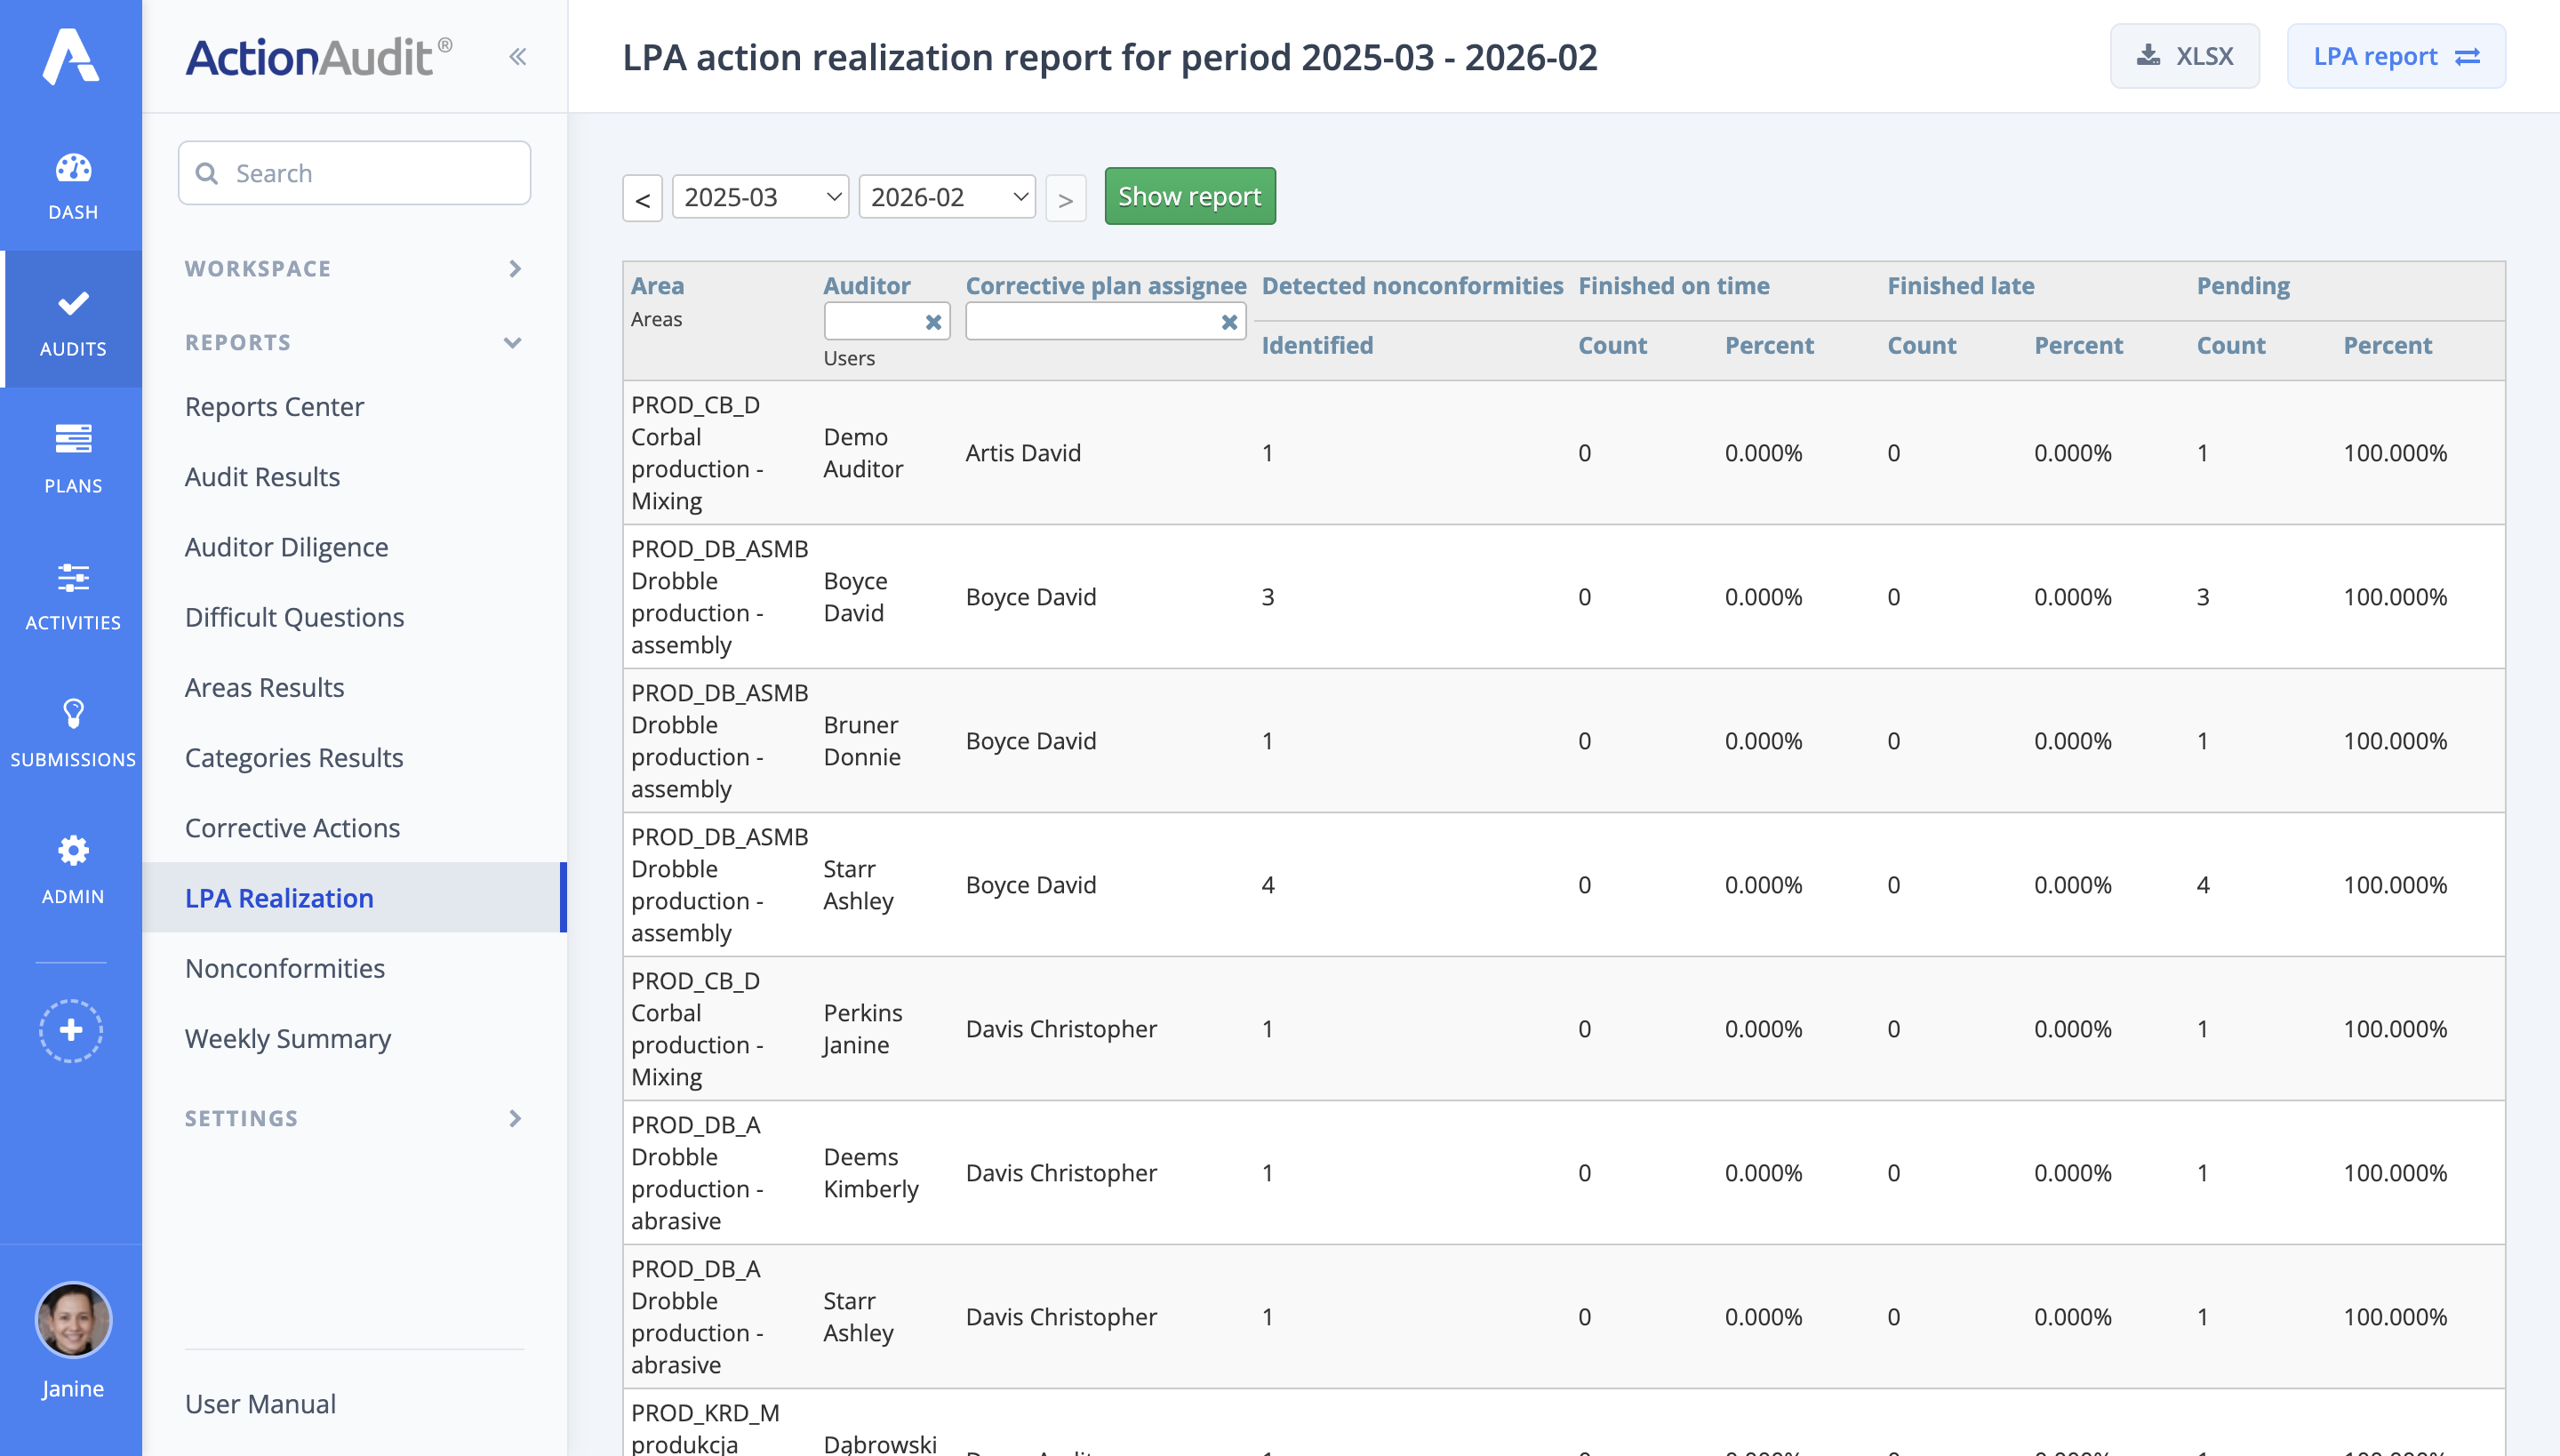
In this view, the following elements are available:
- table by audit layers - a table showing how many audits are currently scheduled and completed in the system, and their percentage completion. The higher the percentage, the fewer LPA audits are awaiting completion.
- table by areas - a table showing how many audits are currently scheduled and completed in the system relative to a given area, and their percentage completion. The higher the percentage value, the fewer LPA audits are awaiting completion.
Nonconformities report
The nonconformities report presents all actions resulting from corrective action plans in a table format.
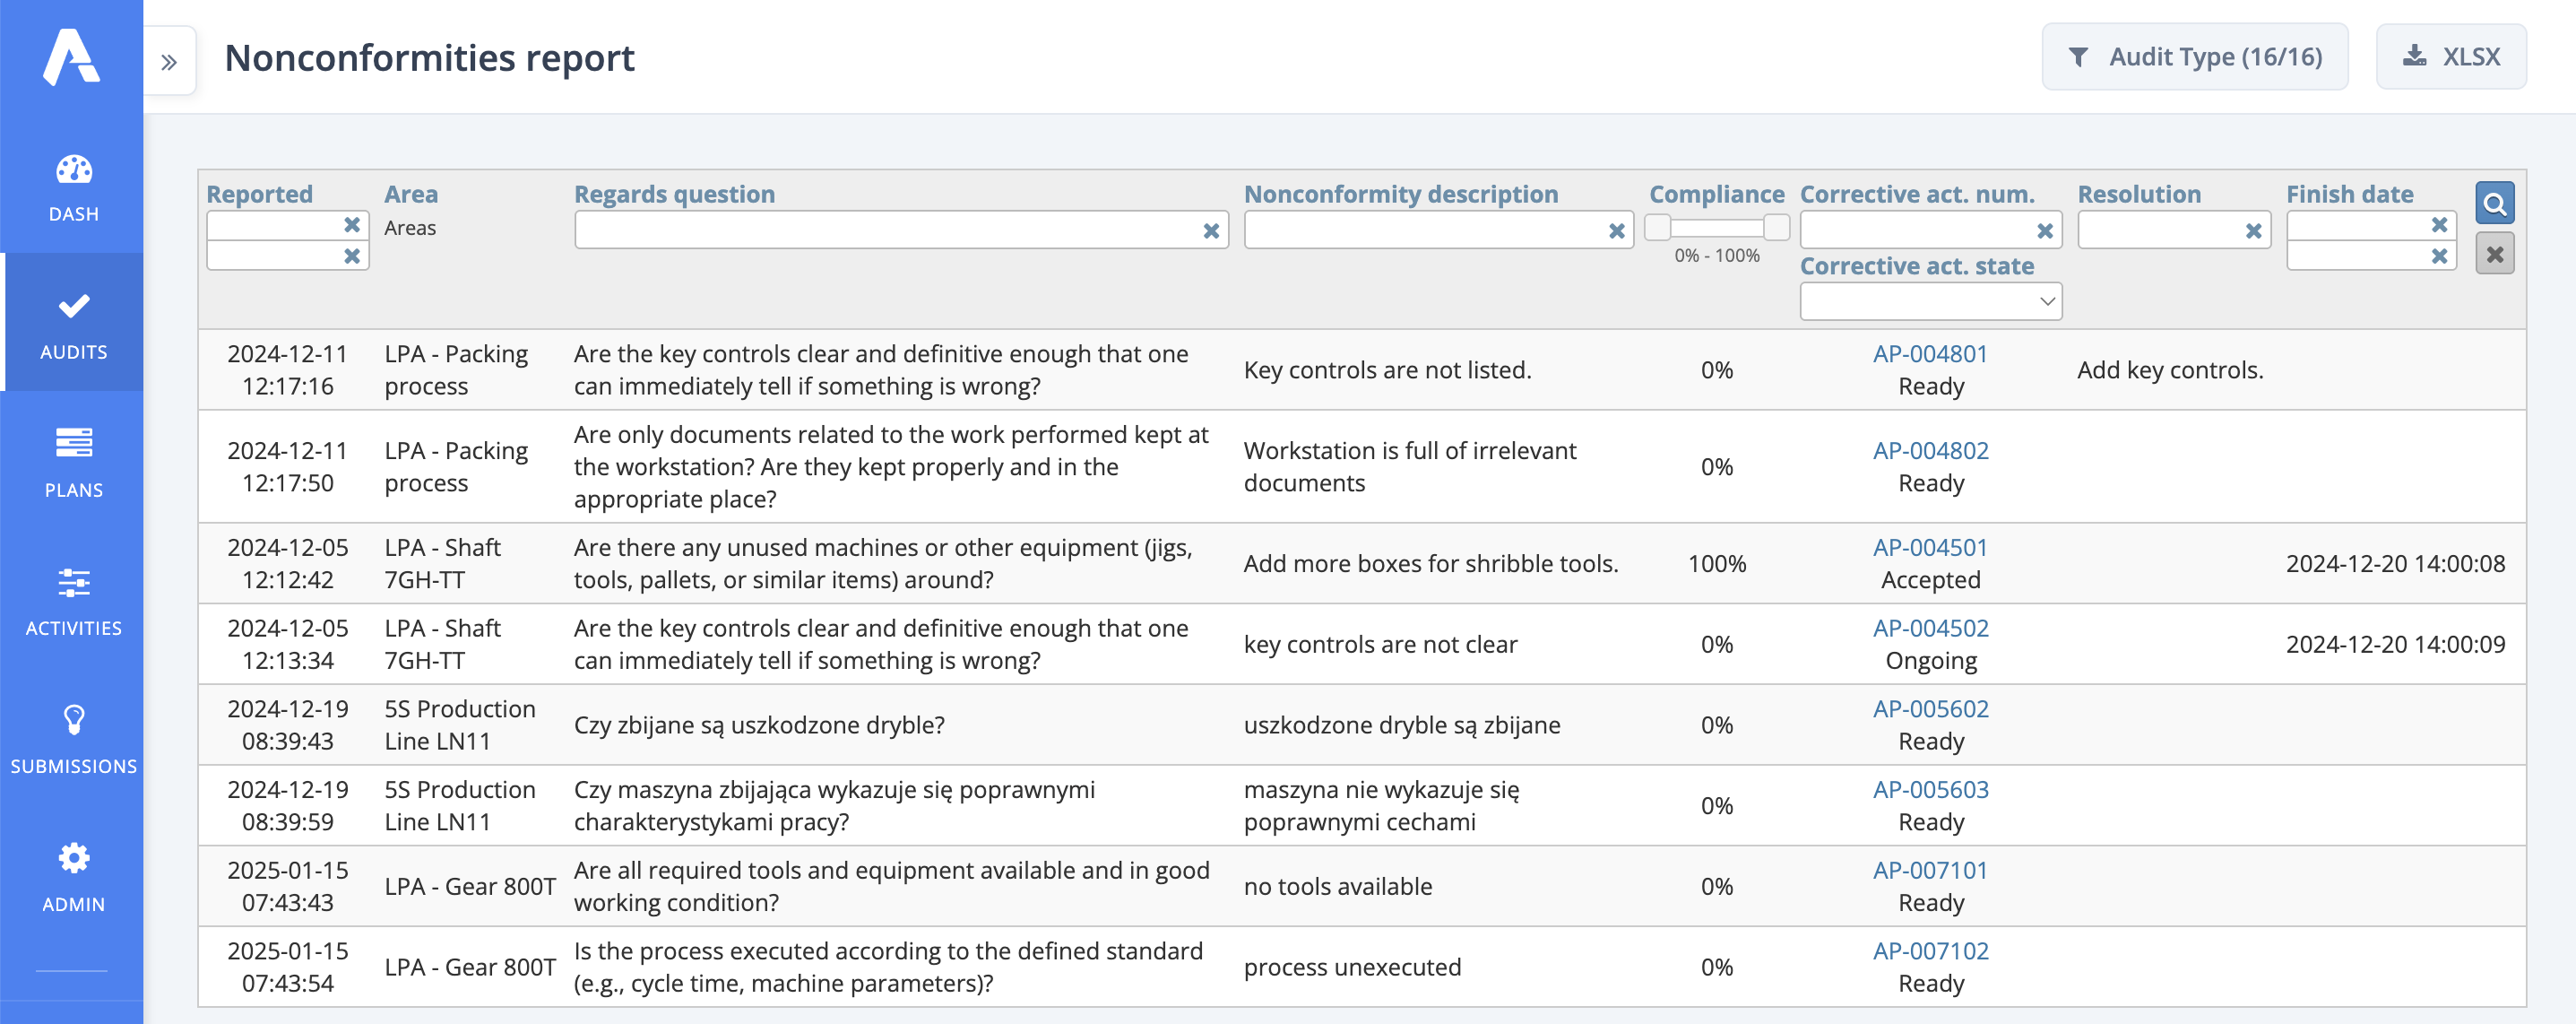
Each table row corresponds to one nonconformity and contains the following information:
- Reported - date of detecting the nonconformity
- Area - the area where the nonconformity was detected
- Regards question - the question that caused the nonconformity detection
- Nonconformity description - description defining the deviation added by the auditor
- Compliance
- Corrective act. num.
- Corrective act. state
- Resolution - how the issue was resolved
- Finish date - date of corrective action completion
Measurements Report
The measurement report enables convenient viewing and analysis of data collected from the parametric scales available in the system.
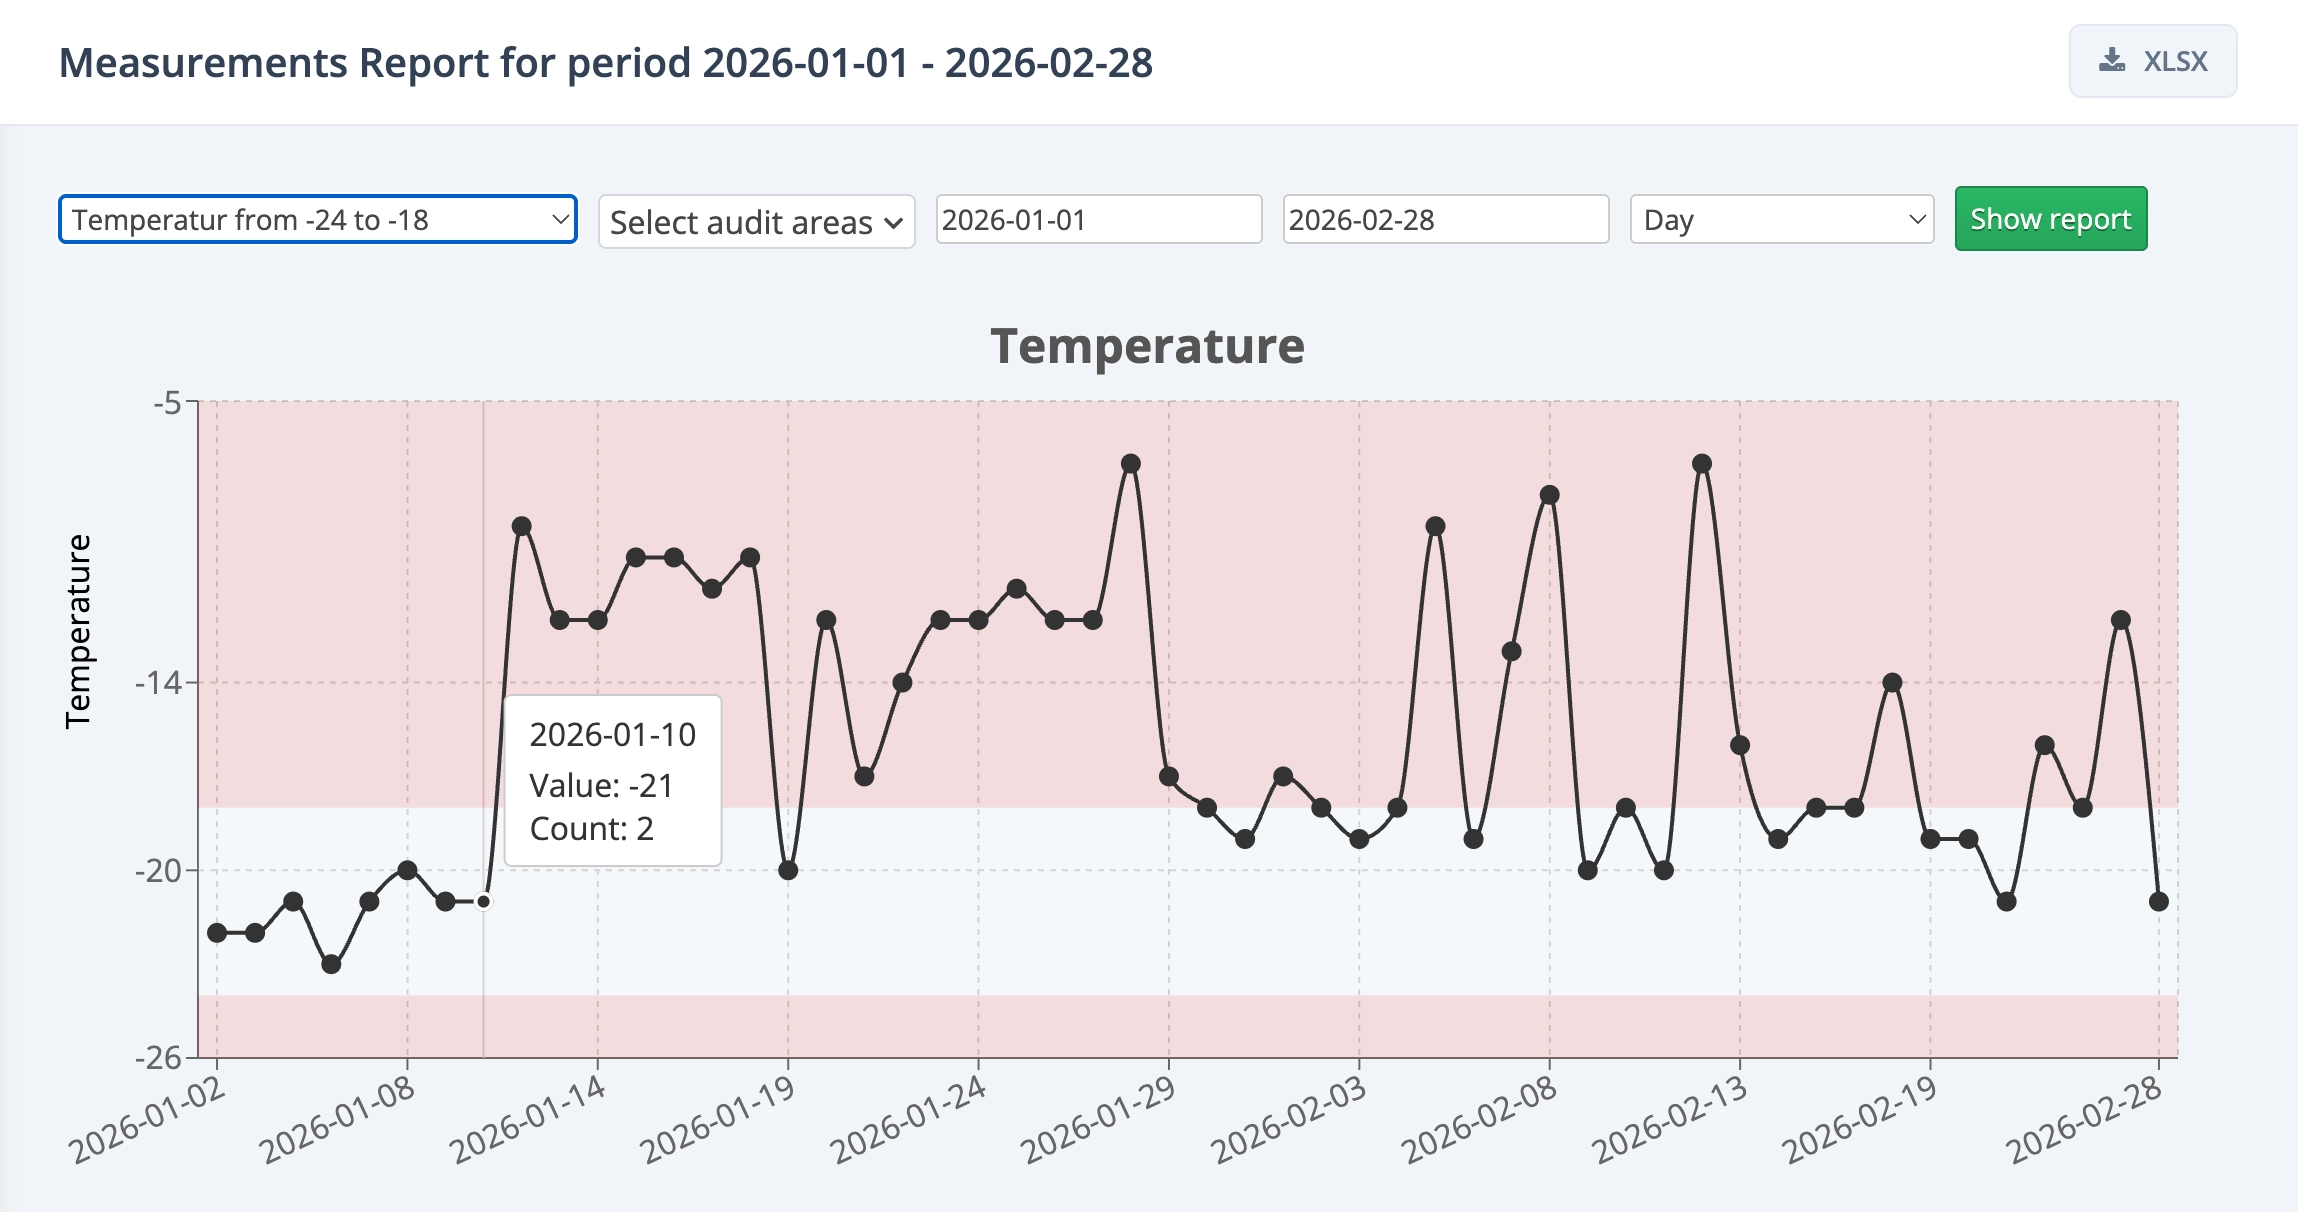
User has the ability to conveniently and clearly monitor and verify all recorded results of the selected scale and audit zone.
The reports view includes the following options:
- scale selection,
- audit zone selection,
- date range selection,
- chart resolution selection:: “Each measurement”, “Hour”, “Shift”, “Day”, “Week”, “Month”.
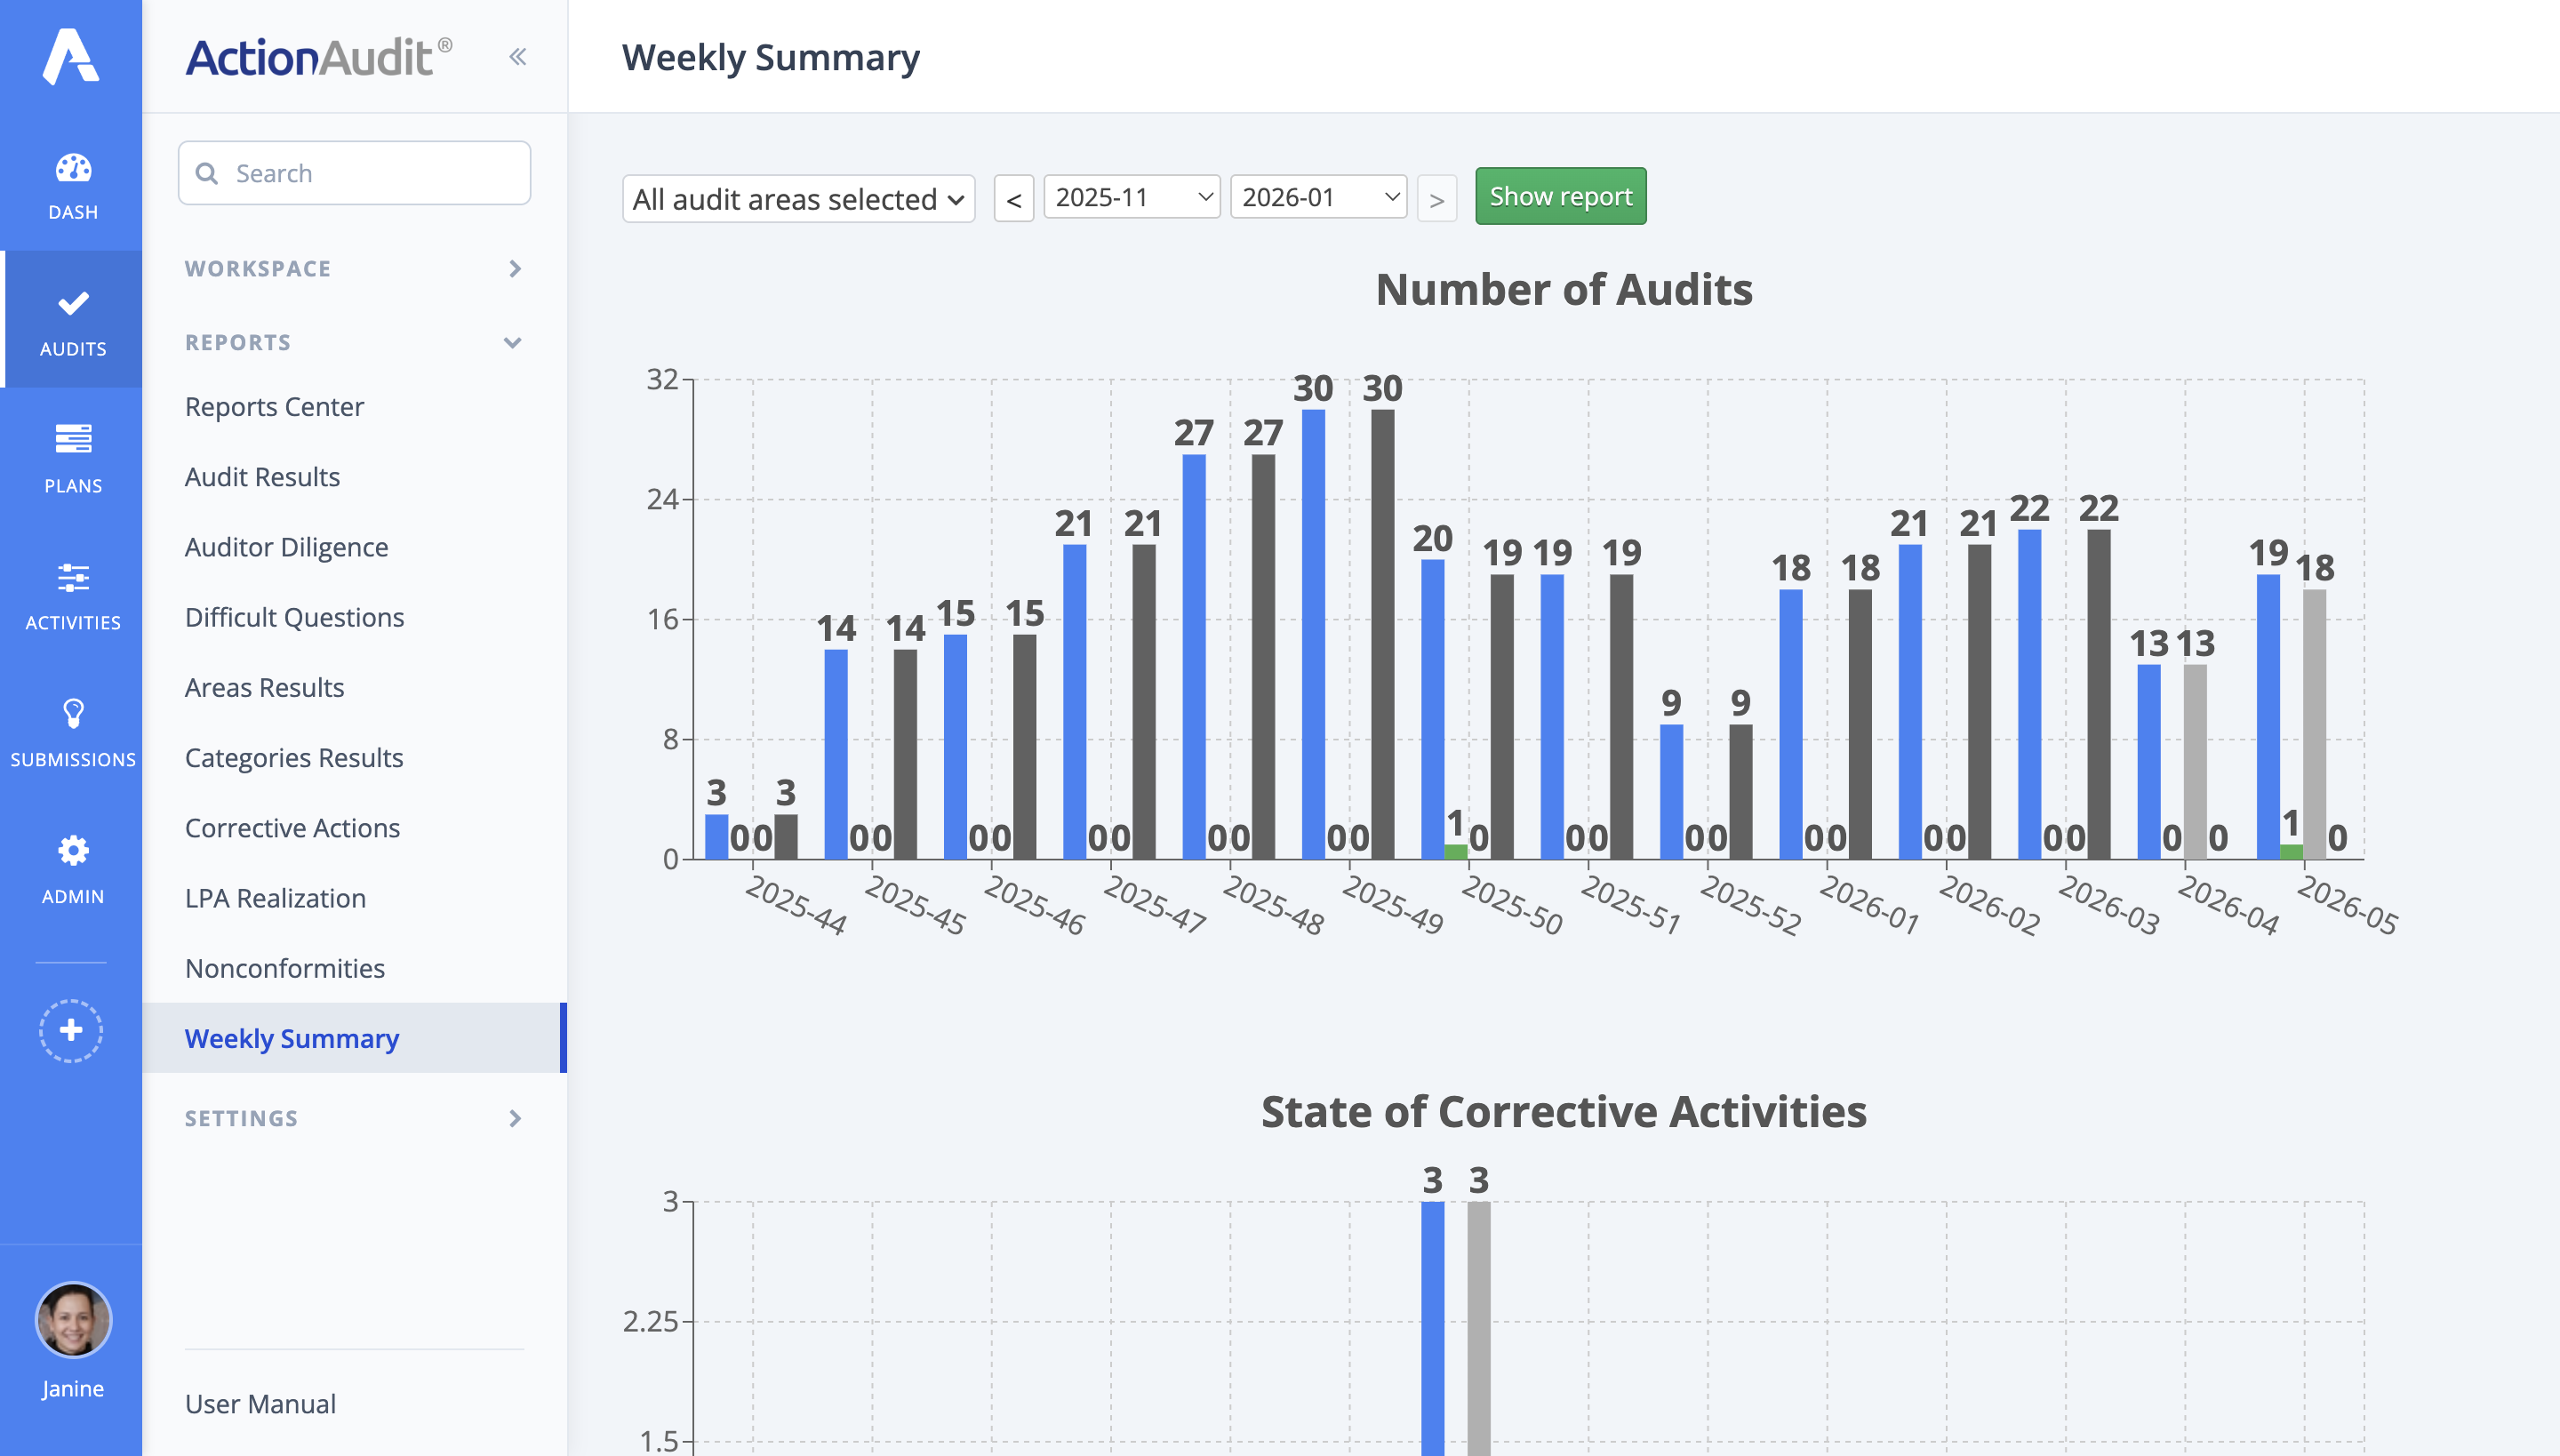
Weekly summary report
The weekly summary report provides an overview of audit statistics on a weekly basis. To select the appropriate time range, use the dropdown menu in the top-left corner. You can also narrow the audits down to specific areas using area zone selection dropdown. To display the selected range, press the green Show report button.
In the report view, you can see the following statistics:
- Number of audits – a report showing the number of audits categorized as All, Completed, Pending, and Unexecuted. Each column in the table represents one week.
- State of corrective actions – a report showing the number of corrective actions, categorized as All, Completed, Pending, and Not Completed. Each column in the table represents one week.
- Areas – a chart displaying the number of irregularities detected in specific areas.
- Audit questions – a chart displaying the number of irregularities detected in specific audit questions.
Hovering your mouse over a column in the tables will display additional details for that week.
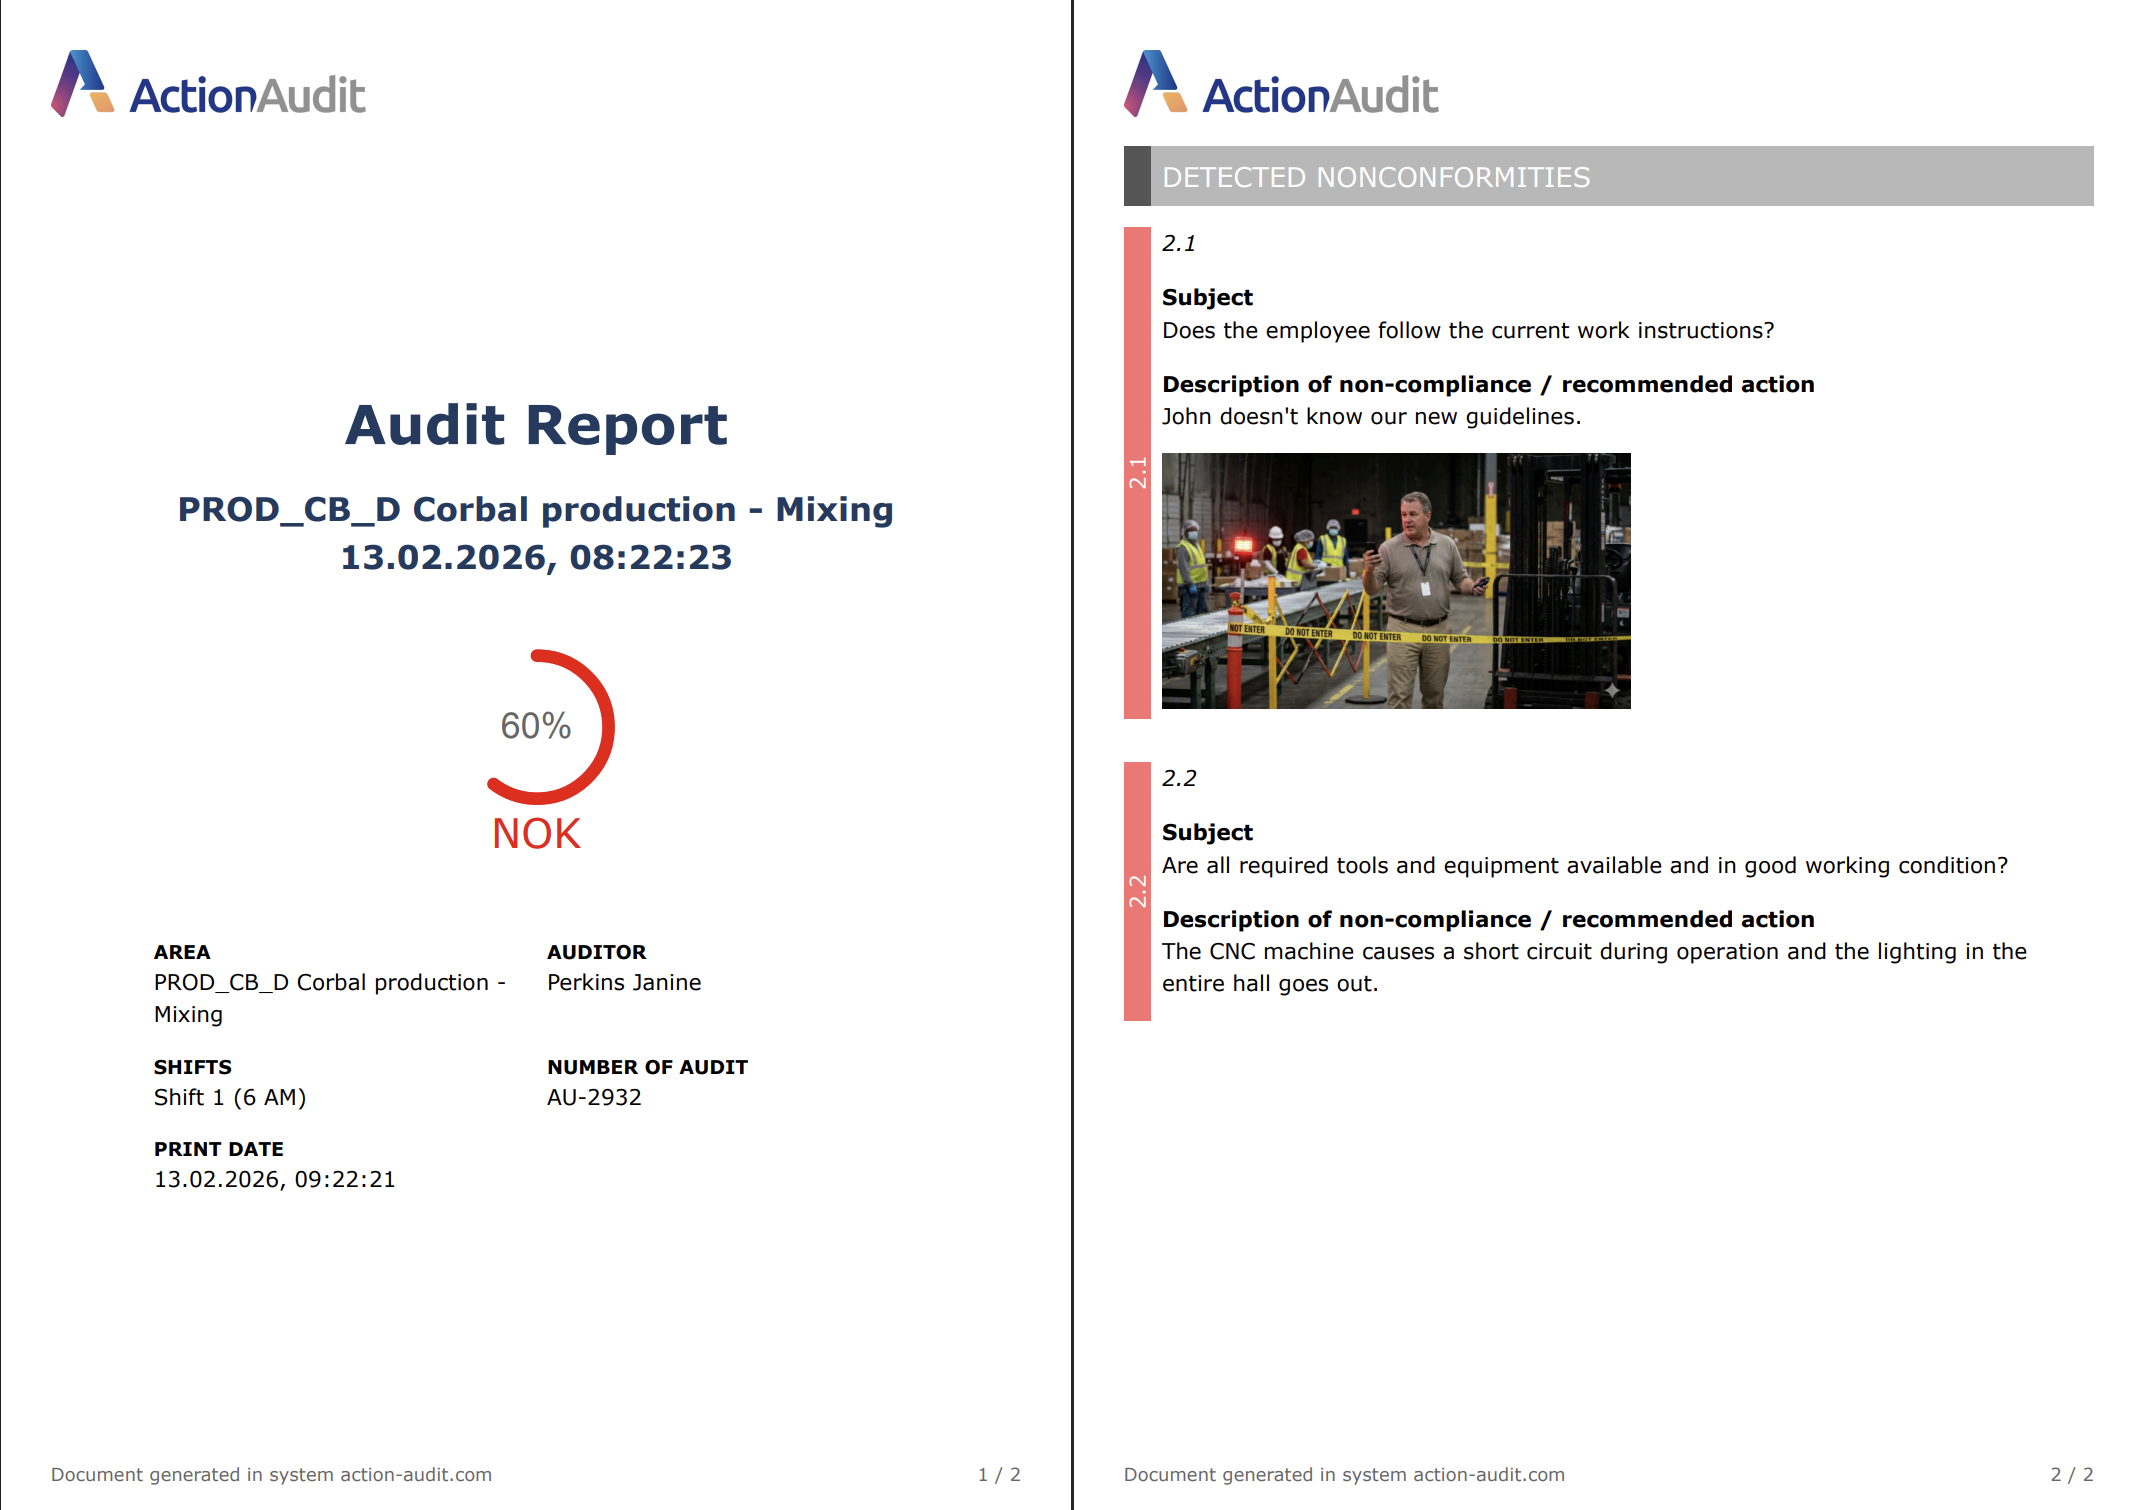
Individual Audit Reports
A group of reports available in the view of a single, completed audit in the top navigation bar under the PDF button. For each completed audit, two reports are available with the status of its execution:
- Simple audit execution report
- Full audit execution report
Both reports are available only in PDF format, have the same header, and contain similar information, but differ only in the level of detail.
The simple report presents information on detected non-conformities in a summarized form, showing at most one thumbnail photo for each.
The full report presents each nonconformity on a separate page with up to three larger format photos. Additionally, the summary section with the most important statistical data of the report is visible on the title page.
A fragment of the report is shown in the image below.